
Beyond the P-Value: Deconstructing the Soccer Referee Bias through Crowdsourced Research
Caveats and pitfalls in crowdsourcing research: the case of soccer referee bias
This paper re-examines a major crowdsourcing research project investigating whether soccer referees exhibit racial bias in issuing red cards. Using Poisson log-linear regression and trend analysis, the authors demonstrate that while a slight statistical association exists (OR 1.34), the data does not support a causal hypothesis of referee bias once player position and yellow card distributions are considered.
TL;DR
Does a darker skin tone make a soccer player more likely to receive a red card? While a famous crowdsourcing project yielded conflicting reports, this study argues that the "bias" is largely a statistical mirage. By controlling for player position and analyzing yellow cards—where bias would be easier to hide—the authors show that the variations in findings are due to a flawed reliance on P-values rather than a true divergence in data.
Background: The Crowdsourcing Paradox
In a landmark study, 29 independent teams analyzed the same dataset of soccer players and referee decisions. The results were polarizing: 20 teams found a "significant" correlation between skin tone and red cards, while 9 found nothing. This created a crisis of confidence—how can the same data lead to such opposite conclusions?
The Core Insight: Position as a Confounder
The authors suggest that we are asking the wrong question. It isn't just about who gets the card, but where they play.
- The Defensive Bias: Defensive players (Center Backs, Defensive Midfielders) are significantly more likely to receive red cards due to the nature of their role.
- Demographic Distribution: The dataset shows a higher concentration of players with darker skin tones in these high-risk defensive positions.
When player position is omitted, skin tone appears to be the cause. When position is included in a Poisson Log-Linear Model, the "bias" effect diminishes drastically compared to the impact of the player's role.
Methodology: The "Yellow Card" Litmus Test
The researchers used a brilliant piece of logic to test the bias hypothesis. If a referee is truly biased, that bias should be most visible in ambiguous situations.
- Red Cards: Usually clear-cut fouls, highly scrutinized by the public and officials.
- Yellow Cards: Subjective, frequent, and less likely to be overturned or heavily debated.
If bias exists, the Odds Ratio (OR) for yellow cards should be equal to or higher than red cards. Instead, the authors found the opposite: players with darker skin tones were actually less likely to receive yellow cards (OR 0.94).
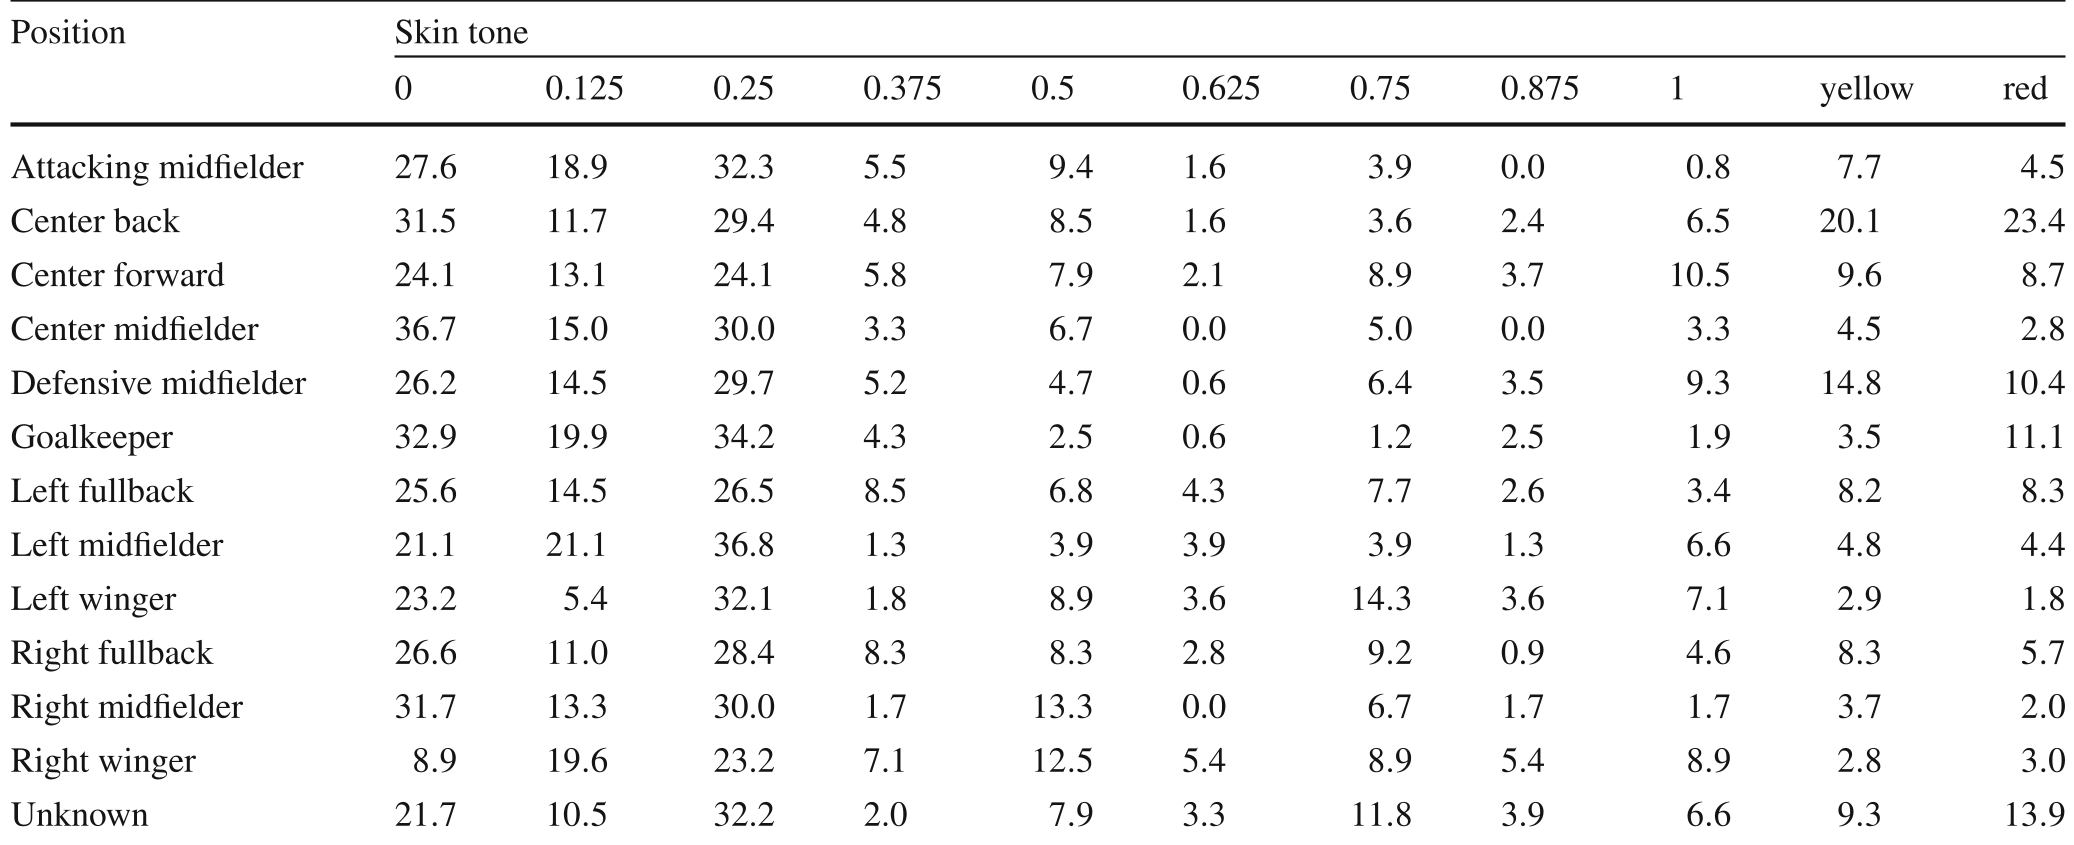 Table 1: The data reveals that Center Backs receive 23.4% of all red cards, a position where dark-skinned players are more prevalent.
Experimental Results: Precision vs. Significance
The authors compared four models: Poisson GLM, Regression Trees (RT), Random Forests (RF), and Deep Neural Networks (DNN). All models performed similarly, but the GLM provided the most interpretable insights.
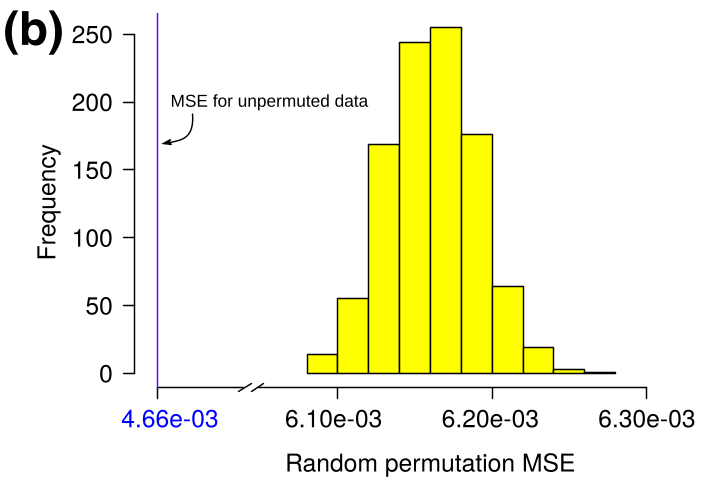 Fig 2: Random permutation tests confirm that while position and skin tone are "predictive," the absolute effect size is minimal.
The study highlights that the 29 teams didn't actually disagree as much as it seemed. When looking at Confidence Intervals (CI) rather than just "is P < 0.05?", most teams' results were remarkably consistent. The "disturbing" variation was simply the result of forcing a continuous reality into a binary "Significant/Not Significant" box.
Deep Insight: The P-Value Pitfall
The most profound takeaway from this paper is a warning to modern data scientists. A result can be "statistically significant" (P=0.00056) but "practically meaningless." The authors argue that an OR of 1.34 for a rare event like a red card represents a negligible absolute increase in risk, likely influenced by unobserved variables or model specifications rather than systemic racism among elite referees.
Conclusion
This paper serves as a masterclass in statistical skepticism. It reminds us that:
- Context is King: Always look for the hidden "Position" variable in your data.
- Doubt the Dichotomy: Stop treating P=0.05 as a magic threshold for truth.
- Extraordinary Claims require Extraordinary Evidence: Labeling an entire professional group as biased based on a single association without a causal mechanism is a leap that the data simply does not support.
Future Outlook: Challenges in crowdsourced research should focus on "Multiverse Analysis"—reporting results across all possible model specifications—to provide a transparent view of how much a conclusion depends on a researcher's subjective choices.