
Deciphering Centrality: Which Metrics Actually Matter in Complex Networks?
An Analysis of Centrality Measures for Complex and Social Networks
This paper presents a comprehensive empirical analysis of eight vertex centrality measures across various complex network models. It identifies that information, eigenvector, subgraph, walk betweenness, and standard betweenness are the most robust metrics for distinguishing node importance, achieving a granularity performance of 95% in diverse social network topologies.
TL;DR
Not all centrality measures are created equal, but many are surprisingly similar. In a massive study of over 7,000 networks, researchers found that high-complexity metrics like Walk Betweenness and Information Centrality are superior at distinguishing nodes (95%+ granularity), while traditional metrics like Closeness and Degree often fail to differentiate between unique positions. Surprisingly, many metrics are so highly correlated (ρ > 0.8) that using them together provides almost no new information.
Background: The Paradox of Choice in Network Science
In the world of Graph Theory and AI, centrality is our compass for finding "important" nodes—whether those are influencers in a social network, critical hubs in an airport grid, or essential proteins in a biological pathway. However, the academic literature is flooded with different definitions of "importance": invisibility, control, independence, or power.
Until now, choosing between them was often a matter of gut feeling. This paper changes that by placing eight major metrics—Betweenness, Closeness, Degree, Eccentricity, Eigenvector, Information, Subgraph, and Walk Betweenness—under an empirical microscope.
The Core Challenge: Redundancy vs. Granularity
The authors identify two silent killers of effective network analysis:
- Redundancy: Many metrics, despite having wildly different mathematical foundations (e.g., shortest paths vs. matrix algebra), rank the same nodes as important.
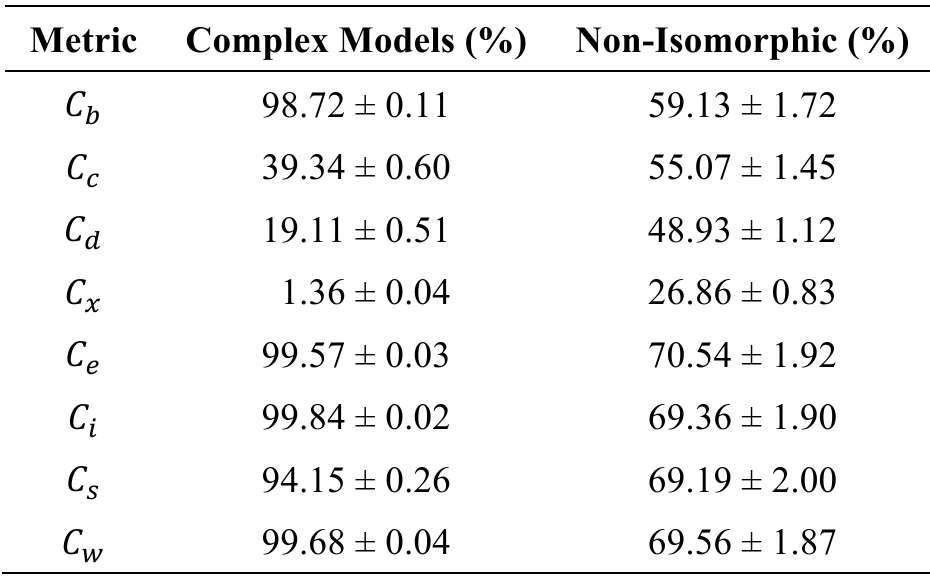
- Granularity: Some metrics are "blunt." They assign the same score to 60% of the nodes in a network, making it impossible to create a meaningful ranking.
Methodology: A Stress Test for Metrics
To find the truth, the researchers didn't just look at one or two networks. They generated 7,165 synthetic graphs using six foundational models, including:
- Barabási-Albert (Scale-Free): Modeling the "rich get richer" effect.
- Watts-Strogatz (Small-World): Modeling tight clusters with short jumps.
- Kronecker Graphs: Realistic models for large social networks.
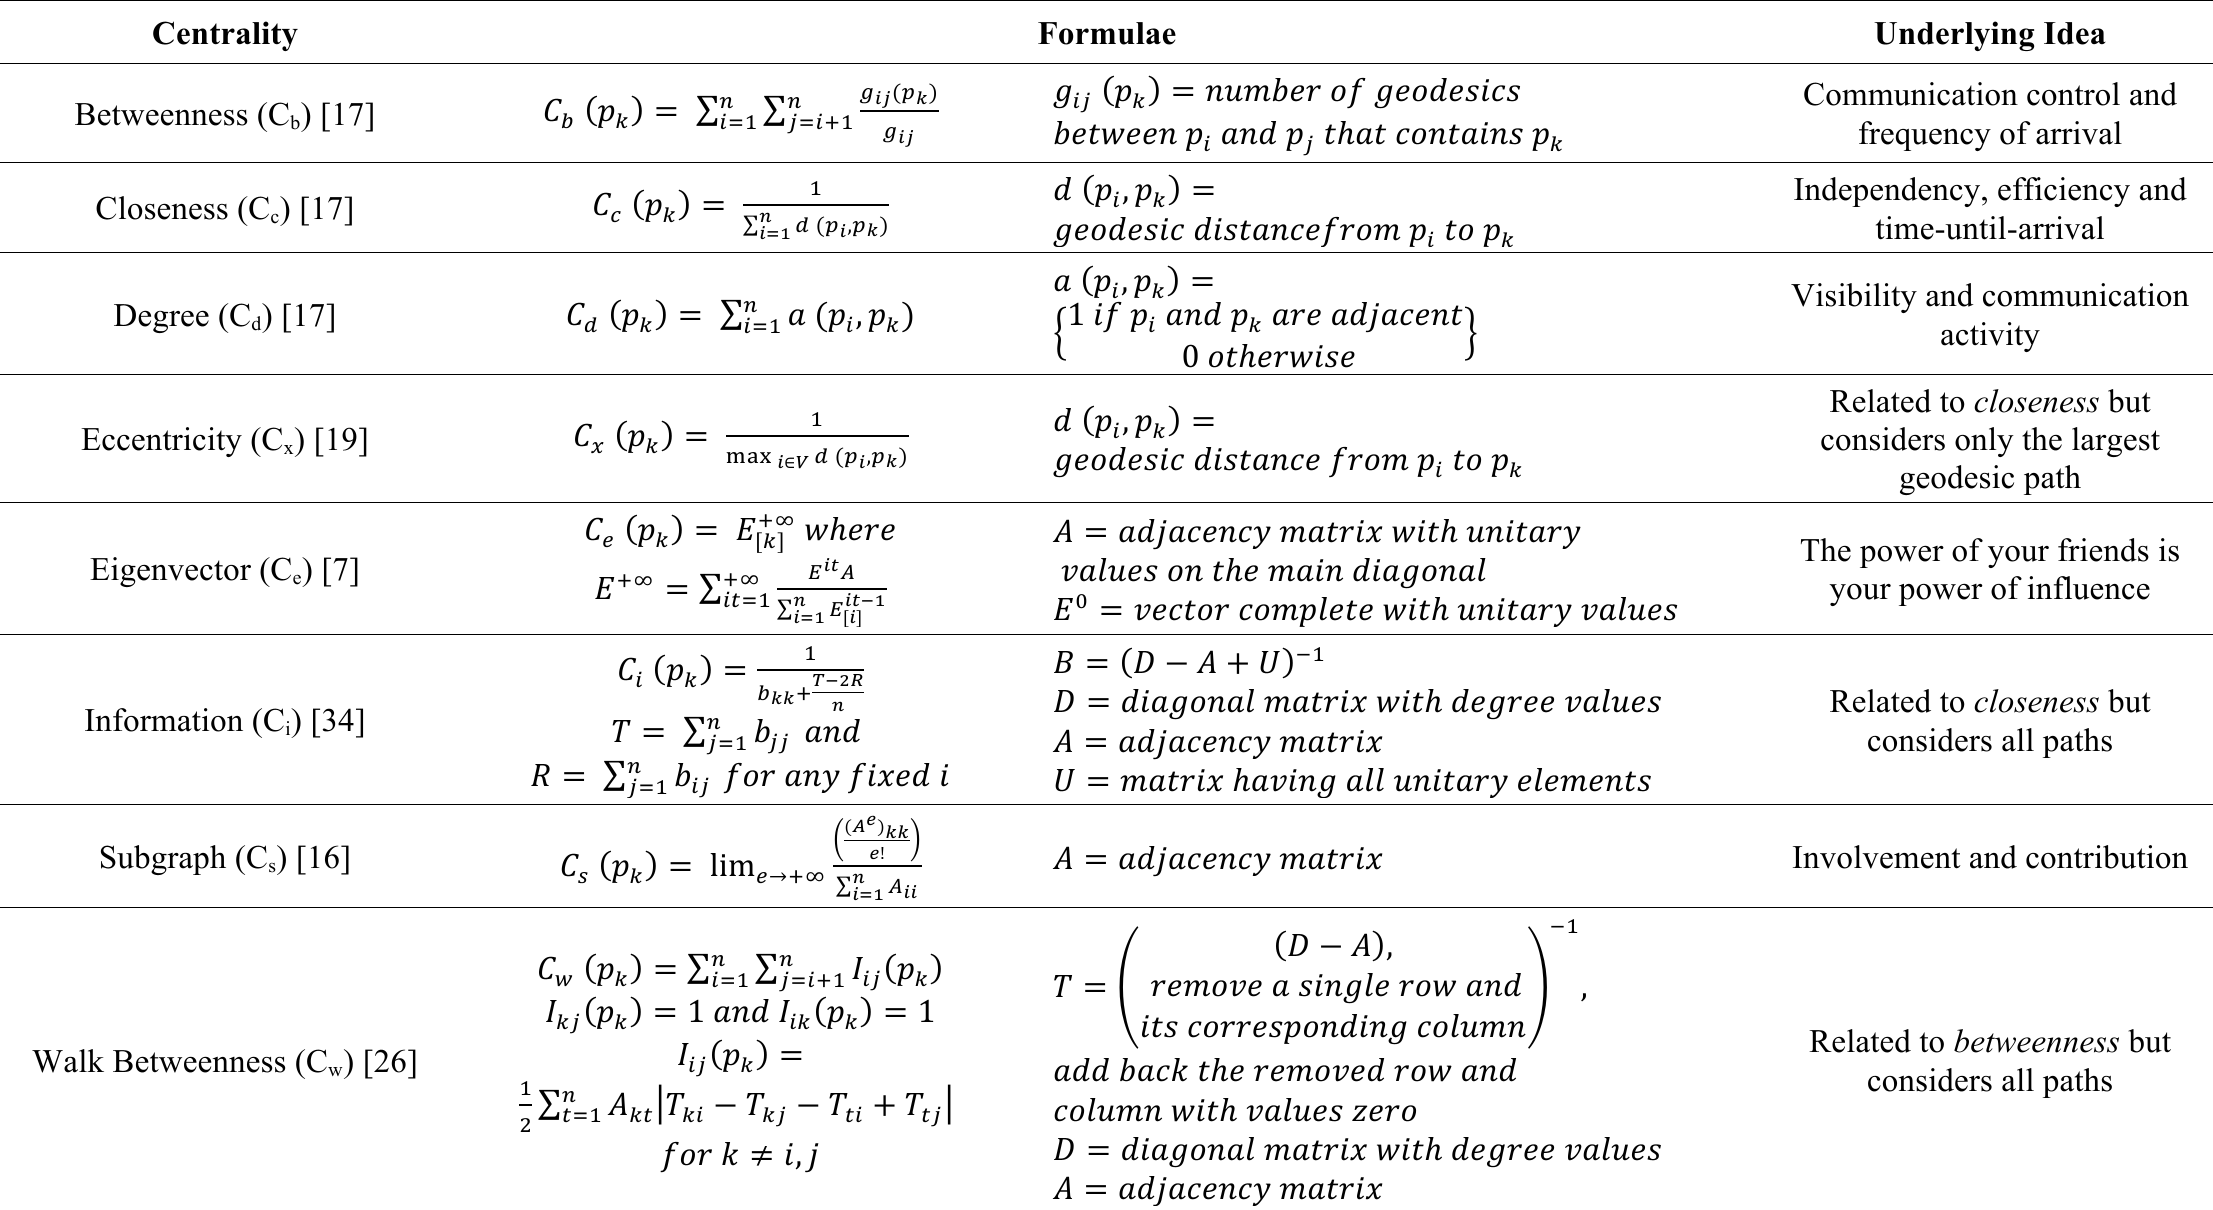
Key Insights from the Data
1. The Redundancy Trap
The study utilized Kendall Tau-b rank correlation to see if metrics agreed on node rankings. The results were startling. Eigenvector and Subgraph centrality showed a near-perfect correlation (1.00) in most cases.
- Takeaway: If you are using Eigenvector centrality, adding Subgraph centrality to your analysis is likely a waste of compute time.
2. High-Resolution vs. Low-Resolution Metrics
If your goal is to rank every node from 1 to N without ties, the "Grand Slam" winners are Walk Betweenness, Information, and Eigenvector.
- Walk Betweenness outperformed all others in most social network models.
- Degree and Closeness were significantly less "fine-grained," often failing to distinguish between nodes that technically have different roles in the topology.
3. Structural Impact
The researchers found that while a network's structure (like its "Scale-Free" nature) doesn't change how well a metric can distinguish nodes (granularity), it does change how the metrics correlate. In Scale-Free networks, the overlap between metrics drops by 20%, meaning your choice of metric matters more in networks with extreme degree imbalances.
Critical Analysis & Conclusion
This paper provides a much-needed "Consumer Reports" guide for network scientists. The most significant finding is the uselessness of Eccentricity in complex networks—it essentially collapses under the "Small-World" effect where everyone is just a few steps from everyone else.
Limitations: The study was restricted to networks of up to 512 nodes due to the complexity of Walk Betweenness. While the authors argue these patterns hold for larger graphs, the behavior of these metrics on "Big Data" scales (billions of edges) remains a frontier for future approximation-based research.
Future Outlook: As we move toward more complex AI models, understanding these fundamental "structural heuristics" will be key to designing better graph sampling methods and more efficient pooling layers in Graph Neural Networks.
Final Recommendation:
- For Speed: Use Degree (Cd).
- For Precision Ranking: Use Walk Betweenness (Cw) or Information (Ci).
- Avoid: Eccentricity (Cx) in any social network context.