
Decoding the Football Identity Card: A Machine Learning Approach to Training Periodization
Characterization of In-season Elite Football Trainings by GPS Features: The Identity Card of a Short-Term Football Training Cycle
This study utilizes an Extra Tree Random Forest Classifier (ETRFC) and autocorrelation analysis to characterize in-season training cycles for elite Italian football players using GPS-derived external load features. The research successfully identifies a sinusoidal training pattern that distinguishes between high-intensity "prep" days and low-intensity "taper" days leading up to a match.
TL;DR
In professional football, achieving a "plateau of performance" throughout a long season is a major challenge. This study moves beyond coaching intuition by using Extra Tree Random Forest Classifiers (ETRFC) and GPS data to map out the "identity card" of elite training. The findings reveal a clear sinusoidal model of training: high-intensity leads the week, while low-intensity tapering ensures match-day readiness.
Problem & Motivation: The Limits of Intuition
The traditional "Block Periodization" used in individual sports (like athletics) doesn't work for football, where players must be ready to perform once or twice every week. Prior research often focused on a few isolated metrics, leaving a "black box" regarding how multidimensional GPS data—like metabolic power and dynamic stress—actually clusters into a weekly pattern.
The authors argue that without a data-driven model, the variability in training loads is too high, often leading to maladaptation or injury. Their goal was to define a repeatable "training identity card" that can guide athletic trainers in prescribing the exact physiological stimulus required at any given point in the week.
Methodology: High-Dimensional GPS Analysis
The researchers monitored 26 elite players in the Italian Serie B over 23 weeks. They extracted 12 distinct GPS features, ranging from simple Total Distance to complex metrics like High Metabolic Load Distance (HMLD) and Dynamic Stress Load (DSL).
The Analytical Engine
To make sense of this data, they used the Extra Tree Random Forest Classifier (ETRFC). Why ETRFC? It is more robust than standard decision trees, as it randomizes both the attribute and the cut-point choice, effectively controlling for over-fitting in smaller datasets. They compared this against a "Dummy Classifier" (baseline) to prove that the patterns found weren't just random noise.
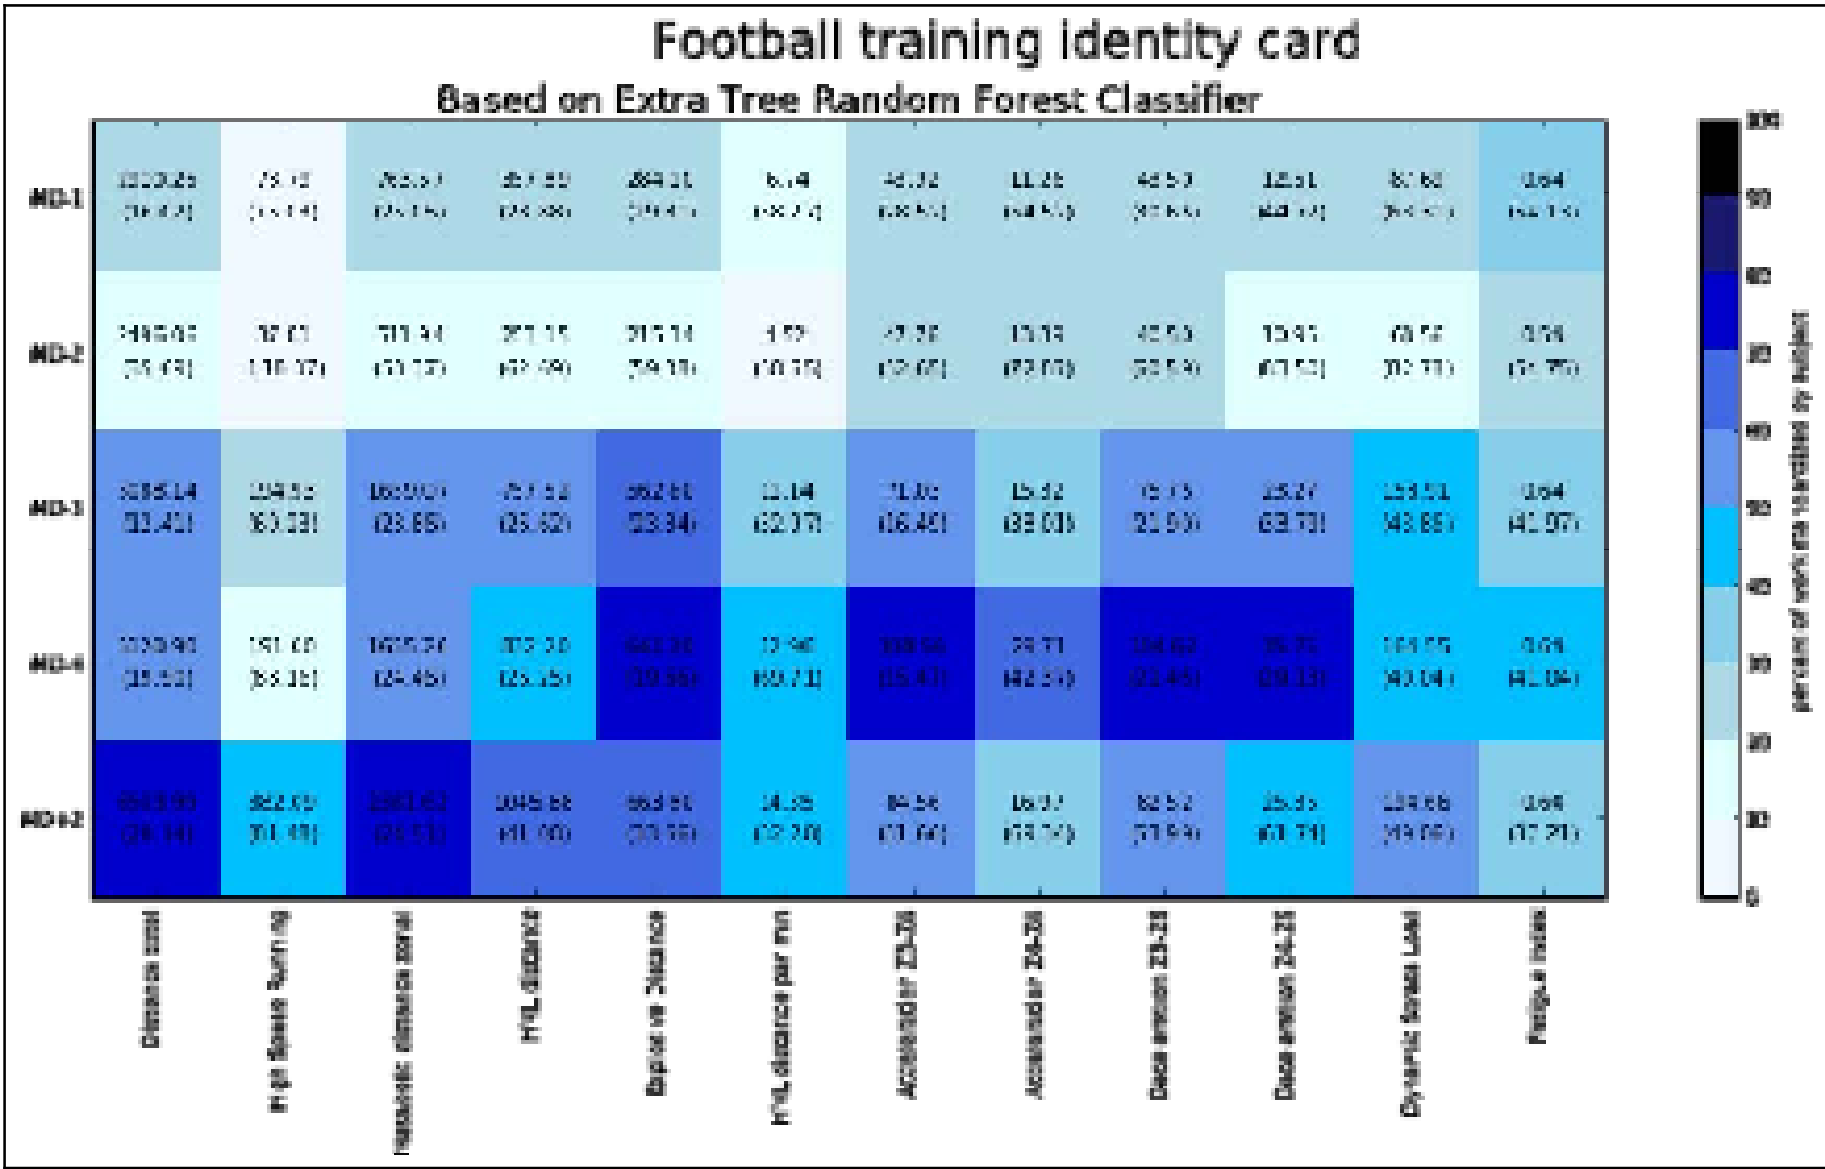 Fig 1: The Training Identity Card showing feature importance and load distribution across the short-term cycle.
The Sinusoidal Pattern: Results & Insights
The study discovered a distinct "Zig-Zag" or sinusoidal pattern in training intensity.
- Macro-Classification: The model was 90% accurate at distinguishing between "Prep Days" (long before the match) and "Taper Days" (just before the match).
- Key Performance Indicators (KPIs): Contrary to popular belief that total distance is king, the most important features for defining the training cycle were Metabolic Distance Zonal and Accelerations (> 2 m/s²).
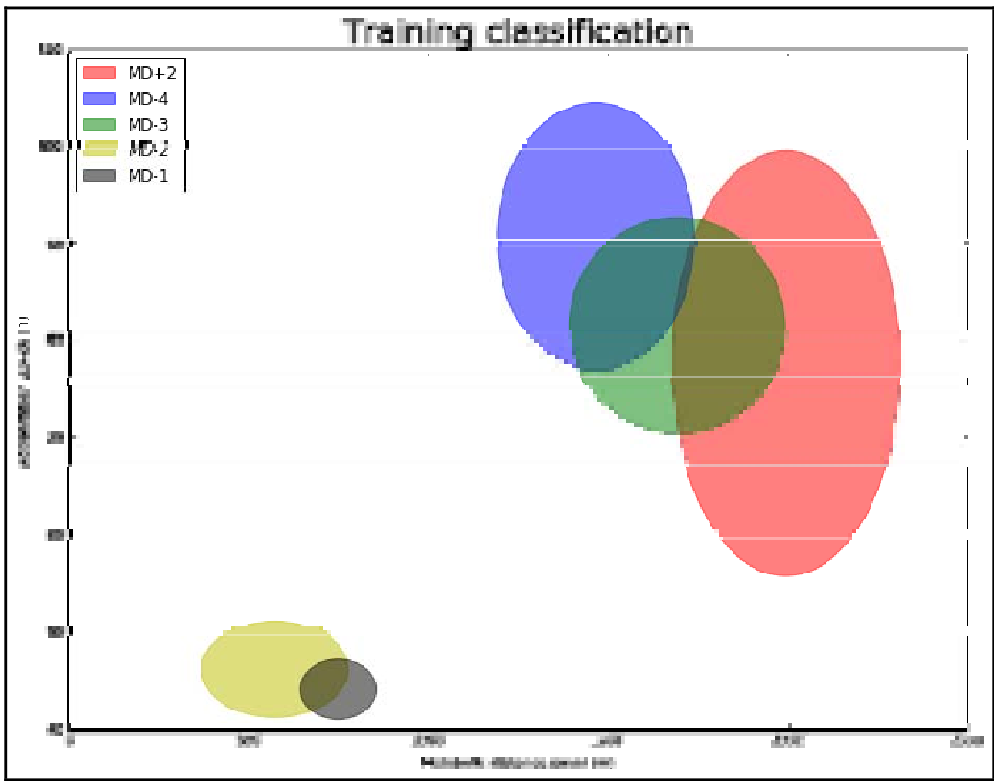 Fig 2: Ellipse plot showing the separation between high-load days (left) and low-load days (right) based on metabolic distance and acceleration.
The autocorrelation analysis (Fig 2 in the paper) showed that while individual days have high variability (intra-training variability), the broader structure of the week remains remarkably consistent across 23 weeks of a season.
Critical Analysis & Conclusion
Takeaway
The core contribution of this paper is the quantification of the training cycle. By identifying that Metabolic Distance is a superior classifier compared to High-Speed Running, the study provides a more nuanced view of "intensity" that accounts for the high-energy cost of accelerations and decelerations common in football.
Limitations & Future Work
The primary limitation was the lack of GPS data from actual matches (due to regulations during the 2013-14 season). Without the "Match Load," the training cycle is like a puzzle missing its center piece. The authors suggest that future models should bridge this gap to predict injury risk—specifically looking for "load discrepancies" where a player's training deviates too sharply from the established sinusoidal identity card.
Practical Application
For sport scientists, this study validates the use of Supervised Learning to audit training programs. If a coach's planned session doesn't "fit" the identity card for that specific match-day proximity, it serves as an early warning for potential overtraining or under-preparation.