
Unmasking Mobility: Why Your Foursquare Score Says More Than Your Tweets
Characterizing users’ check-in activities using their scores in a location-based social network
This paper introduces a novel framework for analyzing user mobility and behavior in Location-Based Social Networks (LBSNs) by utilizing "User Scores" rather than raw check-in data. By applying Non-negative Matrix Factorization (NMF) to weekly score time series, the authors effectively cluster users into distinct behavior profiles while filtering out the noise of dishonest check-ins.
TL;DR
Researchers have moved beyond sporadic "public check-ins" to analyze human mobility. By using Foursquare User Scores—an aggregate measure of verified, honest activity—and applying Non-negative Matrix Factorization (NMF), this study uncovers distinct user archetypes. The findings link high physical mobility to high social connectivity but reveal a surprising lack of tight-knit communities among the most active explorers.
Background: The "Check-in" Data Crisis
For years, academic research into human mobility (how we move through cities) relied on "digital breadcrumbs" left on Twitter or public Foursquare feeds. However, this data is fundamentally broken for two reasons:
- Sparsity: Most check-ins are private or never shared to secondary platforms.
- Fraud: "Location cheating" where users check in to venues they haven't actually visited to earn badges or rewards.
This paper shifts the lens toward User Scores. Because Foursquare's system only awards points for verified, "feasible" check-ins, the score serves as a curated, high-fidelity signal of a user's real-world behavior.
Methodology: Translating Scores into Behavior
The authors treat a user's sequence of weekly scores as a Score Curve. To extract professional insights from these curves, they defined three mathematical properties:
- Slope: The linear trend of activity. Are you becoming a "power user" (positive slope) or a "ghost" (negative slope)?
- Amplitudes: The delta between weeks (). This measures behavioral volatility.
- Wave Lengths: The duration of consecutive increases or decreases, indicating the persistence of a new habit.
Architecture of Analysis
The researchers utilized Non-negative Matrix Factorization (NMF) to cluster these attributes. Unlike standard K-means, NMF is particularly adept at finding latent structures in multivariate data with weak individual predictability.
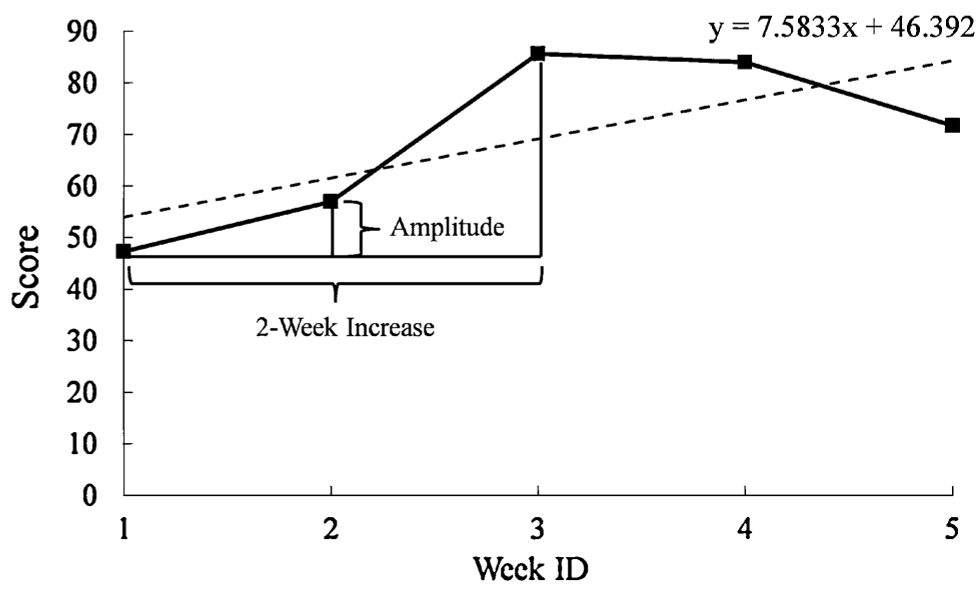 Figure 1: Anatomy of a Score Curve showing Slope and Amplitudes.
Key Findings: The Social-Physical Link
The empirical results from a dataset of 10,254 users in the Pittsburgh area yielded several striking insights:
1. The "Mobile Elite" are Highly Social but Less "Clustered"
Users in Score-based Cluster 2 (high scores) averaged 18.4 friends, compared to only 10.3 for low-score users. However, their Clustering Coefficient was lower. Insight: Highly mobile individuals act as "bridges" between different social groups rather than being stuck in one tight-knit "clique."
2. The Great Decline
A staggering 76% of users exhibited a negative slope. This suggests that while LBSNs provide great data, maintaining long-term user engagement is a massive hurdle for these platforms.
3. Volatility equals Activity
Users with the highest scores also showed the highest "Amplitudes." Their behavior isn't just "high"—it's dynamic. They alternate between intense exploration and periods of routine, whereas low-score users remain static and predictable.
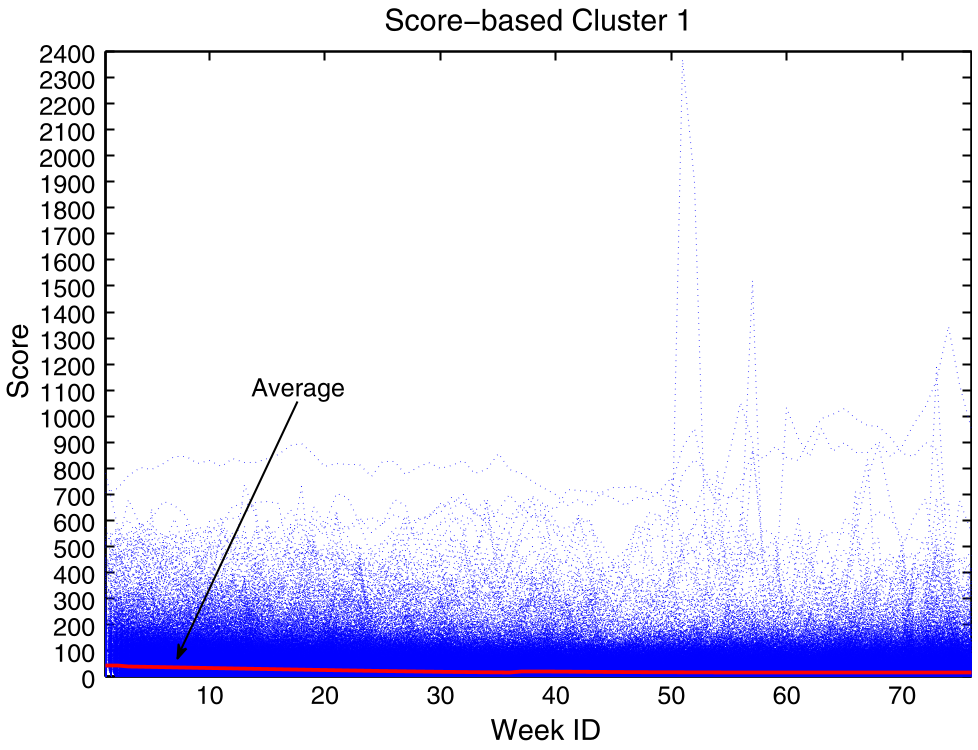 Figure 2: Comparison between Low-Score (top) and High-Score (bottom) user clusters over 76 weeks.
Deep Insight & Conclusion
This work demonstrates that aggregate system-level metrics often contain more "truth" than the raw data points themselves. By modeling the evolution of a score rather than the coordinates of a check-in, the authors successfully bypassed the noise of location fraud.
The Takeaway for Developers: If you are building recommendation engines or social discovery tools, don't just look at what a user did yesterday. Look at the derivative of their activity over time. The "Slope" and "Wave Length" of their engagement are much better predictors of future behavior and social potential than a single GPS coordinate.
Limitations
While the score-based approach is robust against fraud, it is a "black box"—we rely on Foursquare's proprietary algorithm to award points. Future work needs to reconcile these aggregate scores with ground-truth movement data to fully validate the correlation.