
Chelsea Won, and You Bought a T-shirt: Mapping the Pulse of Social E-Commerce
Chelsea won, and you bought a T-shirt: Characterizing the interplay between Twitter and e-commerce
This paper investigates the large-scale temporal interplay between social media (Twitter) and e-commerce (eBay). By analyzing millions of search logs and Tweets, the authors quantify correlations and time lags between social trends and purchasing behaviors, establishing that Twitter often acts as a leading indicator for e-commerce activity.
TL;DR
Can a tweet predict a sale? This seminal study by researchers from eBay and Indiana University explores the synchronized heartbeat of Twitter and eBay. By analyzing hundreds of millions of logs, the paper proves that social media isn't just for talking—it's a leading indicator of what we will buy. With a 25% correlation rate for trending topics and a measurable time lag, the study unlocks the potential for "instant merchandising."
Problem & Motivation
Historically, researchers viewed Twitter and e-commerce platforms as separate silos. One was for "public opinion," the other for "commercial intent." However, human behavior is fluid. A championship win for Chelsea FC immediately triggers a desire for memorabilia.
The authors identified a gap: we know social media moves fast, but how much faster does it move than commerce? If eBay could quantify this gap, it could anticipate "black swan" demand spikes (like celebrity deaths or surprise product launches) before its own search bars even started warming up.
Methodology: Quantifying the Interplay
The team employed a dual-stream time series analysis. They mapped keyword mentions (e.g., "Justin Bieber" or "Air Conditioner") from a 1% Twitter sample and a massive randomized eBay search log.
1. Correlation and Confidence
Using Pearson’s Correlation (), they measured the linear dependence between platforms. To ensure results weren't fluke occurrences, they applied Student’s t-tests to filter out noise, focusing on results with high confidence levels ().
2. The Lag Detection
To answer "Who leads?", they used a Moving Window Method. By shifting the eBay time series relative to Twitter, they found the offset () that maximized the correlation.

Key Findings: The "Lead Time" of Social Media
The experiment yielded three groundbreaking insights:
- The Category Variance: Not all products are social. "Sports" and "Video Games" have massive correlations (~70% for trends). Conversely, "Home & Garden" is less reactive to the social zeitgeist.
- The Twitter Lead: On average, eBay lags Twitter by 4.83 hours. For specific tech launches, like the "Droid 4," Twitter anticipated eBay demand by 3.45 days.
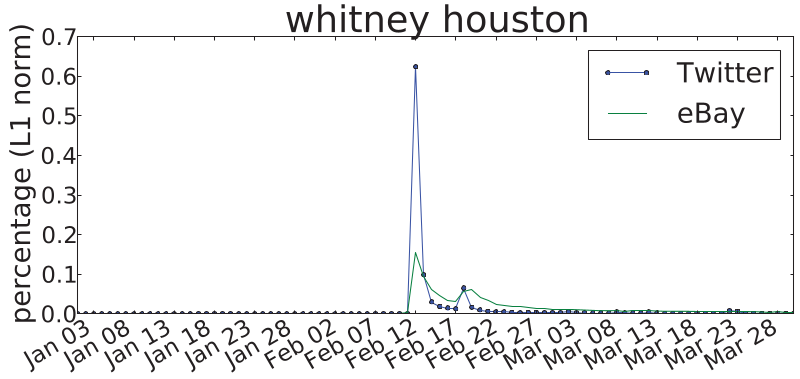
- Peakiness: Twitter is more "peaky" (higher second moment). It spikes and dies quickly. eBay, however, has a "long tail" of interest—people keep buying long after the Twitter conversation has moved on.
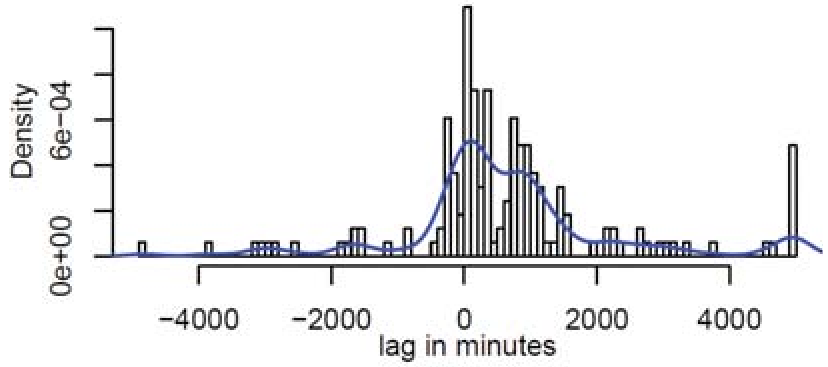 Figure: The histogram shows a heavy skew toward positive lag, proving Twitter usually fires first.
Case Studies: Whitney Houston and Steve Jobs
The authors highlight two fascinating cases:
- Whitney Houston: When the singer passed, Twitter exploded instantly. eBay search followed quickly, but while Twitter chatter dropped off within 48 hours, eBay transaction intent remained high for days, showing that social media captures the event while e-commerce captures the lasting sentiment.
- Steve Jobs: A huge Twitter surge on his birthday didn't lead to eBay sales—proving that "memorial" sentiment doesn't always equal "purchasing" sentiment. However, a smaller news item about a "Steve Jobs Action Figure" caused a massive eBay spike, showing that commercial signals are often hidden in niche news rather than broad popularity.
Critical Analysis & Conclusion
Takeaway: This paper provides a mathematical foundation for Social-to-Commerce (S2C) pipelines. For platform operators, the message is clear: if you aren't monitoring social streams, you are reacting to your customers rather than anticipating them.
Limitations:
- The study uses a 1% Twitter sample, which might miss hyper-niche product trends.
- The "Buy It Now" (BIN) price analysis showed weak correlation, likely because eBay sellers are slow to adjust prices relative to social hype cycles.
Future Outlook: This work paved the way for modern AI-driven inventory management. In the age of TikTok-driven "viral hauls," the 4-hour lead time identified here has likely shrunk, but the underlying physical intuition—that social conversation is the "upstream" of commerce—remains the gold standard for retail tech.