
Deciphering China's Economic Pulse: A Network-Visual Fusion Approach
Chinese regional economic cooperative development model based on network analysis and multimedia data visualization
This paper proposes a Chinese regional economic cooperative development model by integrating network analysis and multimedia data visualization. It utilizes spatial panel data models to analyze GDP growth across 31 provinces (1990-2012), achieving a high goodness-of-fit (R-squared: 0.9975) in identifying regional disparities and convergence patterns.
TL;DR
Regional economic disparity in China is not just a matter of geography—it's a complex network of "infusion" and "leakage" effects. This paper introduces a sophisticated model that combines Spatial Network Analysis with Multimedia Data Visualization to map how capital, labor, and institutional innovation flow across 31 provinces. By moving beyond static tables to dynamic "information maps," the researchers achieved a 0.9975 goodness-of-fit in predicting regional growth patterns.
Background: The Limits of Proximity
For decades, regional analysis followed the "neighborhood rule": if your neighbor is rich, you might become rich. However, this paper argues that modern economic relationships are multi-threaded. A coastal province like Guangdong might be more closely linked to an inland hub through "Broker Plates" than to its immediate geographical neighbor. The authors identify a "dual role" of government and market that creates a network structure traditional static models simply cannot capture.
Methodology: The Core Engine
The researchers built their framework on two pillars:
1. The Spatial Panel Lag Model
The study extends the Solow Growth Model by adding Institutional (Sys) and Technical (Tech) variables.
- Formula:
- This allows them to quantify how much "Institutional Innovation" (marketization, urbanization, openness) actually contributes to the bottom line compared to raw labor or capital.
2. Network Analysis & Block Models
Regions are categorized into four "Blocks":
- Main Benefit Plates: High internal growth, low spillover.
- Net Overflow Plates: High external impact.
- Brokers: Acting as bridges between developed and backward regions.
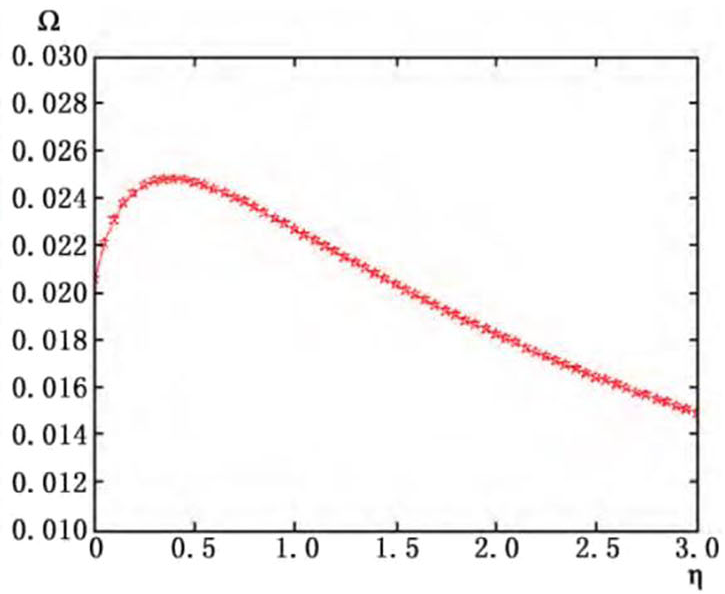 Fig: Visualizing the influence of social capital and leisure preference on the growth curve.
Visualizing "Information Landscapes"
One of the paper's strongest assertions is that the human brain processes visual data 70% faster than text. Using LISA (Local Indicators of Spatial Association) Time Paths, the authors visualize how a province's GDP relative to its neighbors moves over time—curved paths indicate volatile transitions, while straight lines show steady growth.
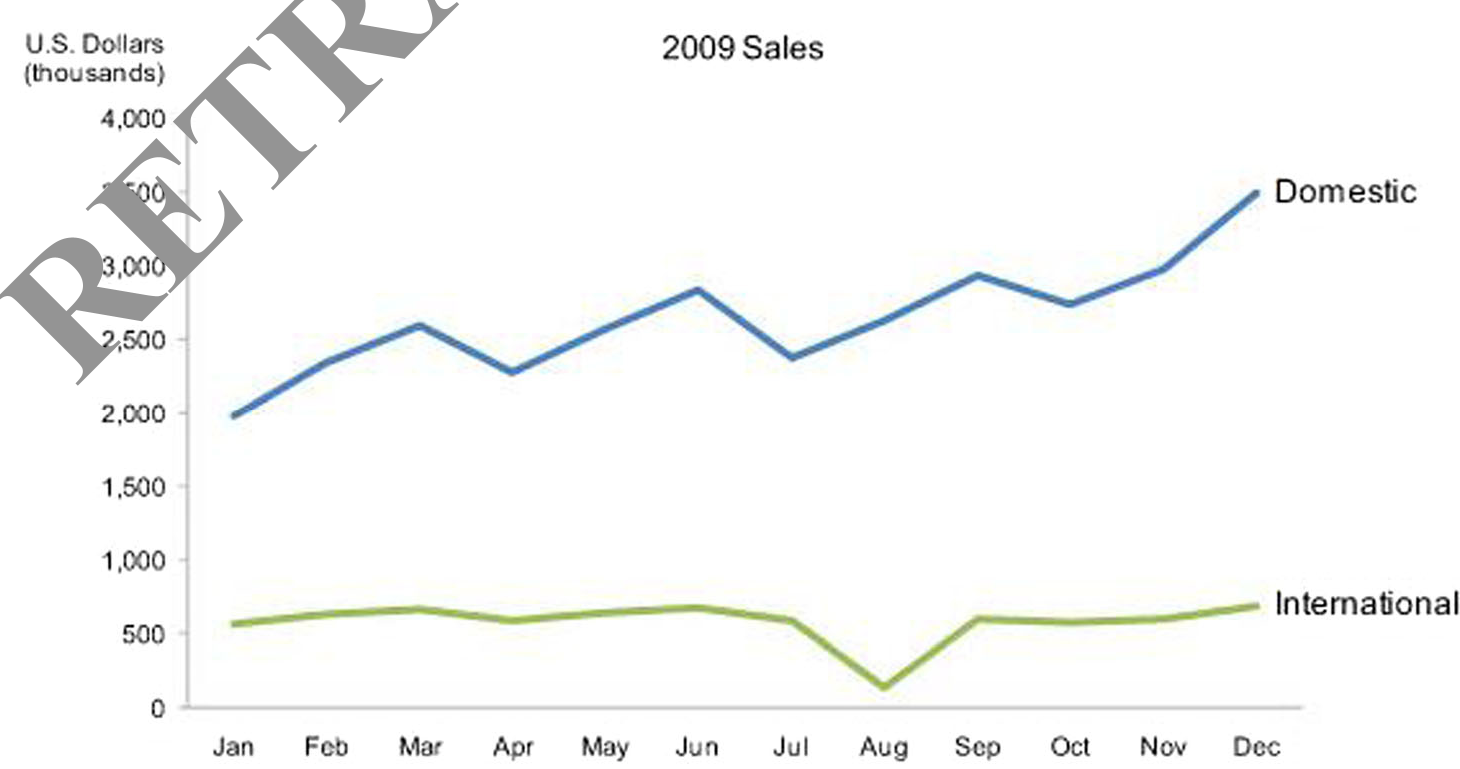 Fig: Comparison of raw data vs. visual trend mapping for decision making.
Key Insights from the Results
- The East-West Divide: While the Gini coefficient shows a general downward trend (convergence) since 2001, the "backward" regions (Class IV) like Guizhou and Qinghai still suffer from "leakage effects"—where their best resources flow out to "infusion" centers in the East.
- Institutional Power: The accumulation of institutional elements in neighboring regions creates a "pointing-in" effect. Essentially, good policy is contagious.
- Factor Efficiency: In the spatial lag model, the impact of labor and capital was confirmed (P < 0.01), but the Space-Time Fixed Effects model proved to be the most accurate (LogL = 1469.5), proving that economic growth is a four-dimensional problem.
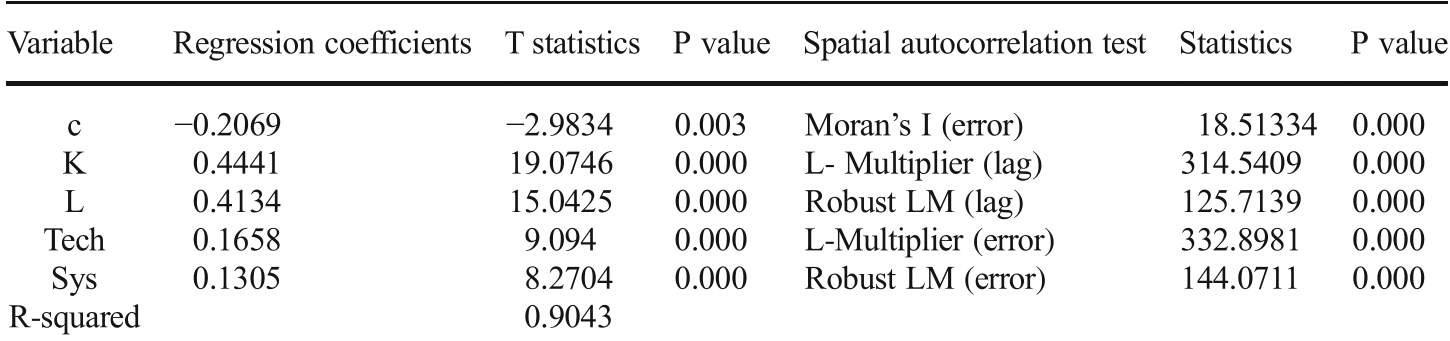 Table: Regression coefficients showing the positive driving effects of K, L, Tech, and Sys.
Critical Analysis & Conclusion
Takeaway
The paper successfully demonstrates that regional development is not a localized phenomenon but a networked synergy. The shift from "extensive growth" (pumping in capital) to "intensive growth" (facilitating factor flow and institutional transparency) is no longer a suggestion—it is a statistical necessity.
Limitations
The study relies heavily on the Rook Adjacency for spatial weights, which might still underplay "leapfrog" connections (e.g., Shanghai's direct impact on far-western Xinjiang via specific aid programs). Furthermore, the multimedia mining focus is more on presentation than on unstructured data ingestion (like analyzing satellite imagery or social sentiment).
Future Outlook
As we move toward 2030, integrating Real-time Big Data Governance into this spatial framework will allow for "Smart Economic Mapping," where policy adjustments can be made quarterly based on visual shifts in the network density of regional interactions.