
Sensing the City: Detecting Social Events through the Pulse of Taxi Traces
City-Scale Social Event Detection and Evaluation with Taxi Traces
The paper introduces a city-scale social event detection and evaluation system using taxi GPS traces. By modeling regional human flow dynamics through passenger pick-up and drop-off counts, the system identifies anomalies to locate events and quantify their scale and impact on traffic congestion.
TL;DR
Researchers have developed a method to detect and evaluate city-scale social events—from concerts to shopping festivals—using nothing but taxi GPS traces. By treating a city's taxi flow as a 3D image and applying computer vision techniques like the watershed algorithm, they can pinpoint the "where" and "when" of events with 80% accuracy and quantify their impact on traffic congestion without relying on biased social media data.
The "Invisible" City Dynamics
Our cities are living organisms with predictable rhythms. Every morning, people flow into business districts; every evening, they return home. Social events—concerts, sports matches, or sudden protests—are "arrhythmias" in this heartbeat.
The traditional way to track these is through social media (Twitter/X) or government reports. However, social media is notoriously biased (not everyone tweets) and reporting is often delayed. This paper asks a radical question: Can we treat the entire taxi fleet of a city as a giant distributed sensor to detect these social anomalies?
Methodology: From GPS Points to 3D Probability Volumes
The core insight is that social events involve an unusual concentration of people. This manifests as an abnormal spike in taxi "set-downs" (arrivals) before an event and "pick-ups" (departures) after.
1. Modeling the "Normal"
First, the authors defined what a "normal" day looks like. By applying a Discrete Fourier Transform (DFT) to historical data, they found that over 95% of urban regions follow a strict 24-hour cycle. They modeled this routine social activeness using a Gaussian distribution: Any deviation from this norm represents a potential social event.
2. The Watershed Algorithm: Events as 3D Objects
The researchers divided the city into 10-meter road segments and 1-hour time blocks. This created a 3D Probability Matrix (Day Time Space).
- The Intuition: If you treat the probability values as "elevation" in a 3D landscape, social events appear as deep basins or high peaks.
- The Fix: They applied the Watershed Algorithm, a classic image segmentation technique, to "flood" this 3D space. As the "water" rises, it isolates separate basins, which correspond to the spatial and temporal boundaries of an event.
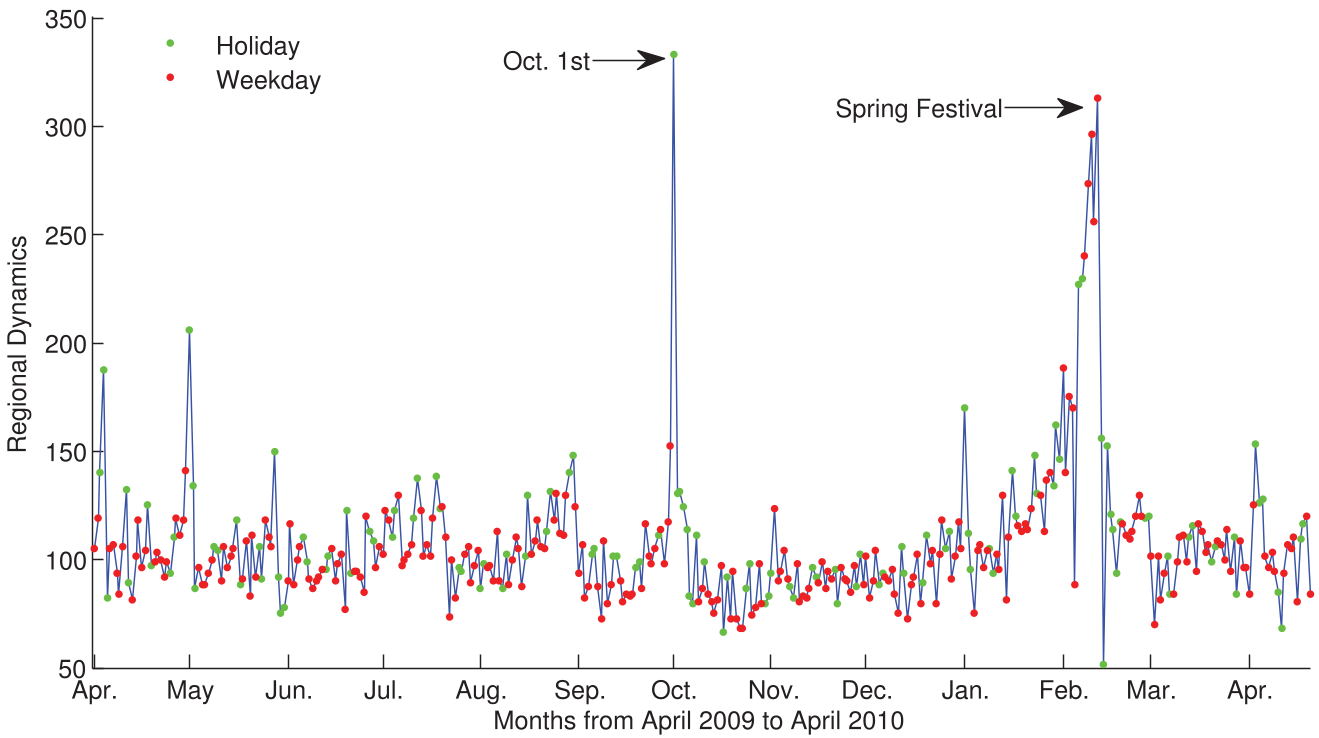 Figure 1: The workflow of event detection from raw traces to 3D matrix segmentation.
Measuring the Impact
It’s not enough to know an event is happening; we need to know its Scale () and its Impact.
- Scale: Defined as the total sum of "extra" passengers beyond the historical average during the event duration.
- Traffic Impact: The authors used a congestion model to calculate the relationship between the event's scale and the resulting traffic jams.
 Figure 2: Correlation analysis between estimated event scale and actual participant numbers at the Shanghai World Expo.
Critical Results & Real-World Validation
The system was tested in Hangzhou and Shanghai. Some of the most impressive findings include:
- High Precision: 8 out of the top 10 detected events were verified as major public events (e.g., concerts by Fish Leong, Dragon Boat races).
- Quantitative Accuracy: At the Shanghai World Expo, the "Taxi-derived Scale" showed a linear correlation coefficient of 0.81 with official attendance records.
- Efficiency: The entire post-processing for a city like Shanghai takes just over an hour on standard consumer hardware, making it viable for near real-time city management.
Deep Insight: Beyond Just Traffic
The brilliance of this work lies in its Inductive Bias. It doesn't just look for traffic jams; it looks for the human intention represented by the act of taking a taxi to a specific destination. Unlike social media, taxi data is "hard" evidence of physical movement.
However, there are limitations. The model relies on the assumption that taxi usage is a representative proxy for the total population. In the age of ride-hailing (Uber/Didi/Grab) and ubiquitous subway systems, the model would need to integrate multi-modal data to maintain its 80% accuracy.
Conclusion
This study proves that the "Digital Shadow" cast by our transportation systems is rich with social meaning. By applying image processing techniques to spatio-temporal data, the authors turned "noisy" GPS points into a powerful tool for urban situational awareness.
Key Takeaway: Social event analysis is moving from "What people say" (Social Media) to "Where people go" (Trace Analysis).