
City Sensing: Visualizing the Digital Pulse of Urban Scale Events
City sensing: visualising mobile and social data about a city scale event
City Sensing is a visual analytics platform designed to monitor the real-time "pulse" of urban environments during City Scale Events (CSE). By fusing anonymized Call Data Records (CDR) with social media streams (Twitter, Instagram), it provides organizers with a dashboard to visualize human mobility and sentiment at a high spatial resolution of 250x250 meter "City Pixels."
TL;DR
City Sensing is an innovative visual analytics framework that fuses telecommunications data (CDRs) and social media streams to monitor large-scale city events like the Milano Design Week. By segmenting the city into a grid of 250m "City Pixels," it detects mobility anomalies and social sentiment in real-time, providing organizers with an unprecedented view of visitor flow and engagement.
The Challenge: Measuring the "Unmeasurable" City Scale Event
Imagine managing an event with hundreds of venues spread across a metropolis like Milan, attracting half a million people over five days. Historically, understanding where people go and how they feel was a post-mortem exercise involving manual surveys and anecdotal evidence.
The authors identified a critical gap: while cities are now instrumented with sensors, the data remains siloed. There was no unified system capable of correlating the physical movement (detected via mobile networks) with the digital conversation (captured via Instagram and Twitter) at a resolution high enough to be actionable.
Methodology: Fusing Heterogeneous Streams
The "Secret Sauce" of City Sensing lies in its Spatio-Temporal Segmentation. To make diverse data sources "talk" to each other, the researchers divided the city into 250m x 250m squares called City Pixels.
1. Mobile Data Analysis & Anomaly Detection
Instead of just looking at raw call volume, the system uses an Anomaly Detector. It establishes a baseline of "systematic behavior" for every pixel. When a sudden surge in calls or data usage occurs—surpassing the typical Wednesday afternoon baseline—the system flags it as a localized event.
2. Social Listening
Parallel to the mobile data, the system scrapes streaming APIs from Twitter and Instagram. It doesn't just count posts; it performs semantic enrichment to identify:
- Sentiment: Are the visitors frustrated or excited?
- Venue Mentioning: Which specific gallery or showroom is "trending"?
- Top Hashtags: What is the core theme of the conversation in that specific pixel?
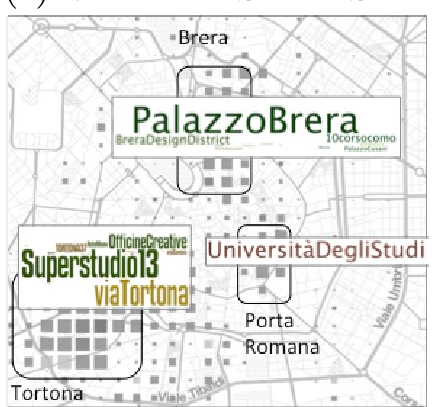 Figure 1: The City Sensing dashboard showing the integrated map, timeline, and data filtering columns.
Experimental Results: Validating the "Pulse"
The system was tested during major events including Milano Design Week and Lucca Comics. The results were striking:
- Spatial Accuracy: Mobile anomalies were heavily concentrated in the exact pixels where major venues were located.
- Organizer Feedback: Event planners confirmed that the "Digital Reflection" matched their ground-truth experience, allowing them to see which districts were successfully attracting crowds in real-time.
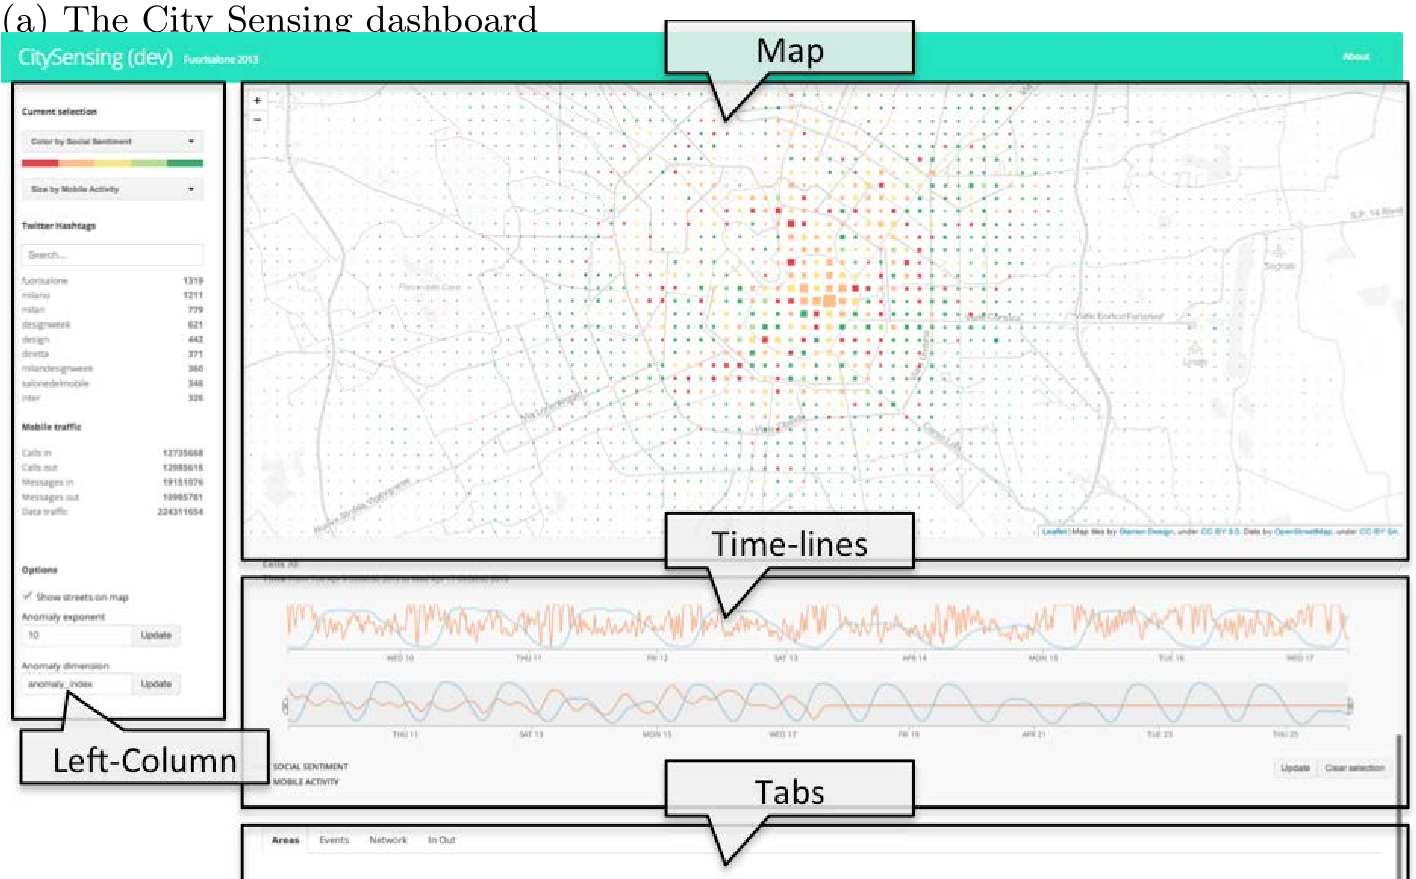 Figure 2: Heatmap showing anomalies in mobile phone activity, highlighting the active hubs of the event.
Critical Insight & Future Outlook
While this 2014 work laid the foundation for "City Data Fusion," it highlights a persistent trend in urban computing: the Value is in the Fusion. A mobile signal tells you that people are there; a tweet tells you why they are there.
Limitations: The early prototype relied on CDRs, which are often provided with a slight delay by telco operators and carry privacy concerns.
Future Work: The authors envision extending this to "Urban Infrastructure Health"—integrating energy consumption, waste production, and transport usage. As we move toward 2026, this logic is being supercharged by AI, allowing cities to not just sense the pulse, but predict congestion and sentiment before they peak.
Takeaway for Professionals
For urban planners and event marketers, City Sensing proves that the city is no longer a "black box." By leveraging the passive data generated by smart devices, we can transform urban management from a reactive discipline into a proactive, data-driven science.