
Beyond Single Metrics: Decoding Fund Performance via K-Means Clustering
Clustering analysis in the evaluation of securities investment funds
This paper proposes a data-driven framework for evaluating securities investment funds using Clustering Analysis. By applying the K-means algorithm to 40 equity funds, the study classifies funds into distinct performance groups based on a multi-dimensional index system, achieving a systematic way to guide rational investment decisions.
TL;DR
In the volatile world of securities, relying on a single ratio to pick a fund is a recipe for disaster. This paper introduces a Clustering Analysis framework that moves beyond traditional "single-index" evaluations. By leveraging the K-means algorithm, the research segments the equity fund market into high-stability blue chips, undervalued growth plays, and high-risk laggards, providing a multidimensional map for rational investors.
The "Index" Trap: Why Traditional Evaluation Fails
For decades, investors have leaned on the "holy trinity" of finance: Treynor, Sharpe, and Jensen. While mathematically sound, these metrics often act as silos. A fund might have a stellar Sharpe Ratio but an underlying Beta (market sensitivity) that makes it unsuitable for a conservative portfolio.
The authors argue that the "Securities Investment Fund" market has unique characteristics distinct from the general stock market. The challenge is not just finding "high return," but identifying the structure of that return—is it driven by market volatility (Beta) or management skill (Alpha)?
Methodology: The Five-Pillar Index System
To solve this, the study constructs a comprehensive feature vector for each fund. Instead of looking at one number, the K-means algorithm "sees" five:
- Accumulated Net Value: The "real" historical growth.
- Total Rate of Return: Short-term performance.
- Standard Deviation: The "noise" or volatility.
- Sharpe Ratio: Risk-adjusted efficiency.
- Beta Coefficient: Sensitivity to the broader market.
The Clustering Engine
The research employs the K-means algorithm, a partitioning method that minimizes the distance between data points and their respective cluster centers (centroids).
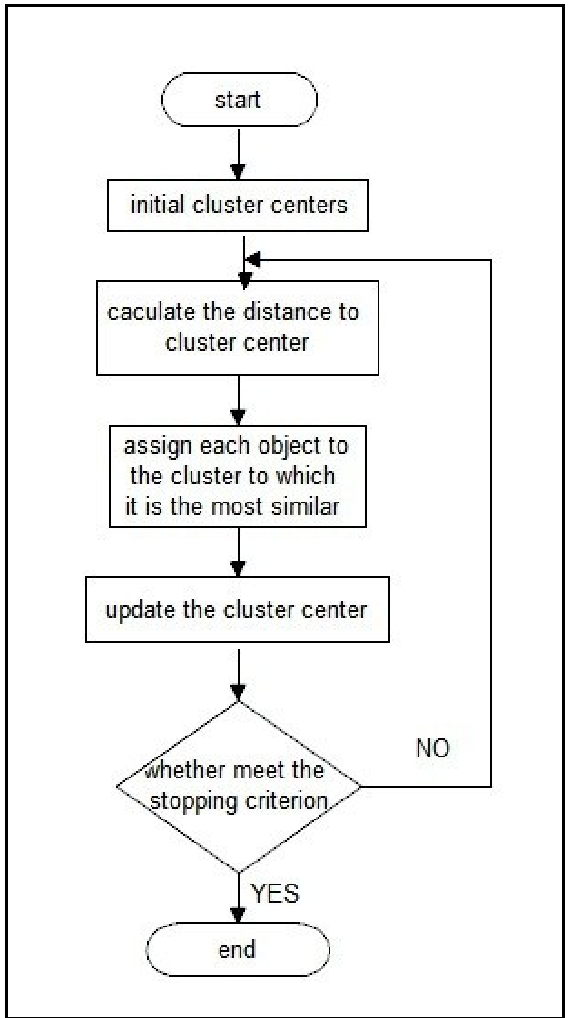
The logic is intuitive:
- Step 1: Randomly pick seeds.
- Step 2: Group funds by their "Euclidean proximity" in the 5D feature space.
- Step 3: Iteratively refine the center of these groups until the variance within the group is minimized.
Empirical Findings: Identifying the "Winners"
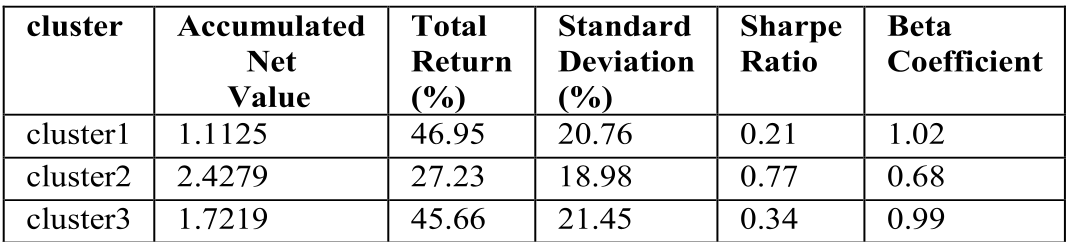
The study sampled 40 open-ended equity funds. The K-means model (with ) revealed three distinct "personalities" in the fund market:
1. The "Blue-Chip" Stalwarts (Cluster 2)
- Profile: Highest Accumulated Net Value (2.42), Peak Sharpe Ratio (0.77), and Lowest Beta (0.68).
- Strategy: Focused on high-visibility, large-cap companies.
- Verdict: Recommended for long-term holding.
2. The "Undervalued" Opportunists (Cluster 3)
- Profile: Moderate Beta and Sharpe, but highest Standard Deviation (21.45).
- Strategy: Hunting for undervalued stocks, leading to higher "swing" in returns.
- Verdict: Suitable for periodic, short-term tactical entries.
3. The "High-Volatility" Laggards (Cluster 1)
- Profile: High Beta (1.02) and poor risk-adjusted returns (Sharpe 0.21).
- Verdict: Avoid. These funds capture market risk without delivering the excess return to justify it.
Critical Insight & Practical Value
The real power of this work isn't just in the math—it's in the visual intelligence it provides. By looking at the cluster centroids, an investor can immediately see that Cluster 2 offers the "sweet spot" of low market sensitivity and high cumulative value.
Limitations to Consider:
- Static Snapshots: The data is a snapshot (Dec 2014); clustering attributes change as fund managers rotate.
- Soft Factors: The model ignores "Human Alpha"—the reputation of the asset management company and the specific track record of the fund manager.
Conclusion
This study proves that data mining isn't just for high-frequency trading or stock price prediction. By applying clustering to the fund evaluation index system, we can strip away the "marketing noise" and group funds by their actual risk-return DNA. For the modern investor, this is the difference between gambling and systematic wealth management.