
Unlocking 150 Years of Swiss History: A Data Mining Approach to Population Dynamics
Clustering Temporal Population Patterns in Switzerland (1850–2000)
This paper presents a data mining framework to analyze long-term population dynamics across 2,896 Swiss communities from 1850 to 2000. By employing mixture models and Bayesian scaling, the authors identify 880 distinct temporal patterns which are then clustered into 8 SOTA spatial abstractions, such as "Working Suburbia" and "Booming Suburbia."
TL;DR
Researchers have moved beyond simple "before-and-after" comparisons to analyze 15 decades of Swiss population data (1850–2000). By combining Bayesian statistics with the Pareto principle, they identified 8 distinct "growth identities" for 2,896 communities, providing a new map for urban planners to understand how "Working Suburbia" and "Alpine Losers" evolved over a century and a half.
Problem & Motivation: The Trap of Two-Point Comparisons
Most demographic studies are "snapshots"—they compare two points in time (e.g., population in 1900 vs. 2000). This obscures the journey of a community. Did it boom during industrialization and then stagnate? Or did it remain stable for a century before exploded into a suburb in the 1960s?
Furthermore, standard statistical tools often fail because geospatial data is rarely "normal." High-growth outliers or dying mountain villages create extreme variances that break traditional Euclidean distance calculations. The authors' insight was to treat population change not as a single number, but as a Temporal Pattern—a signature made of 15 unique decade-long identities.
Methodology: From Raw Data to Temporal Signatures
1. The Mixture Model & Bayesian Scaling
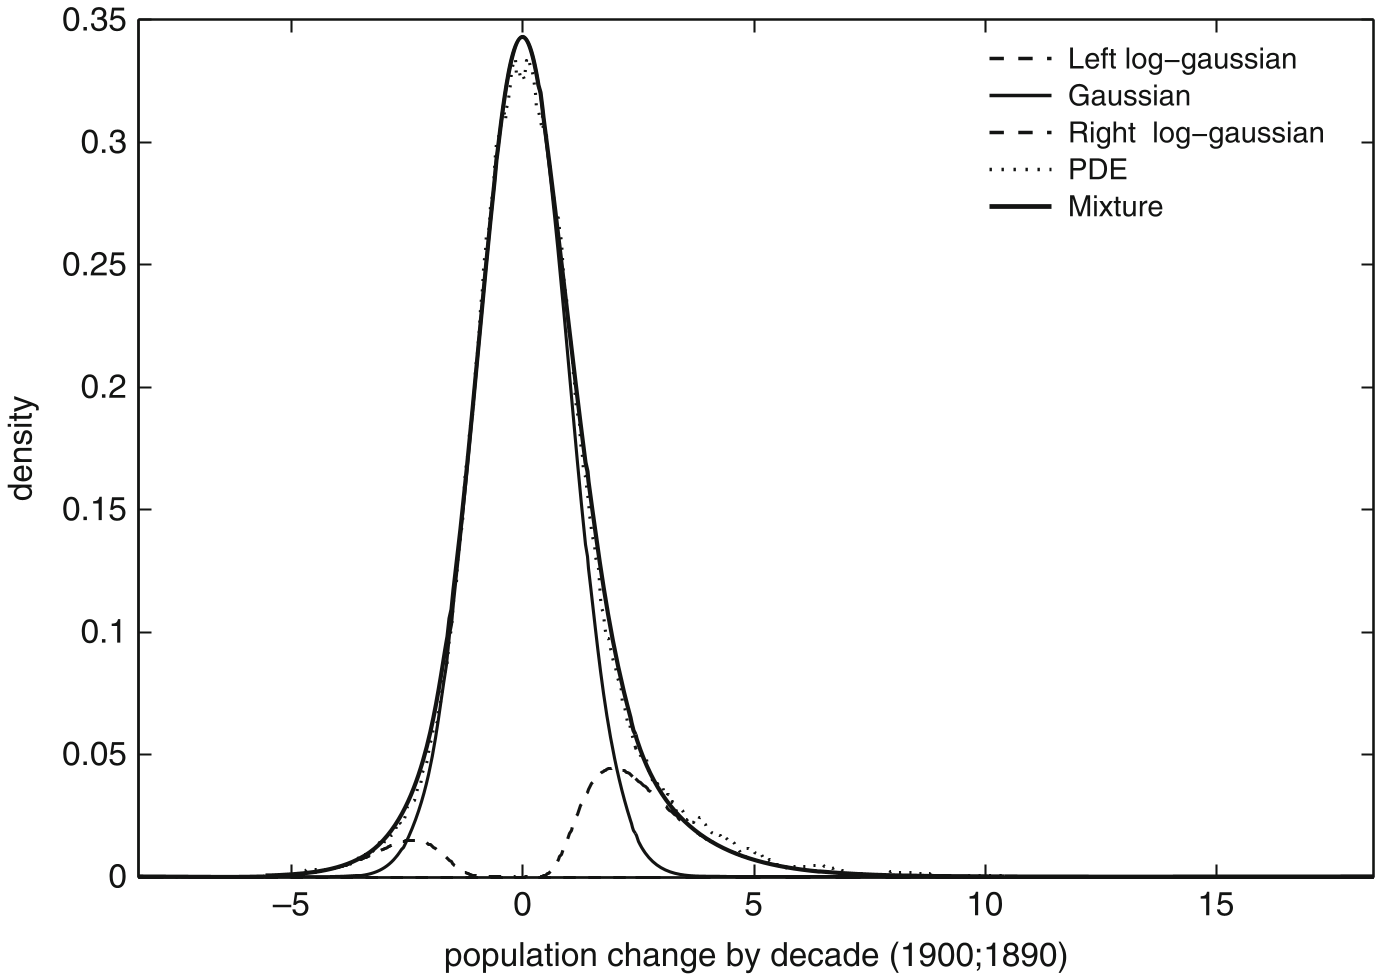
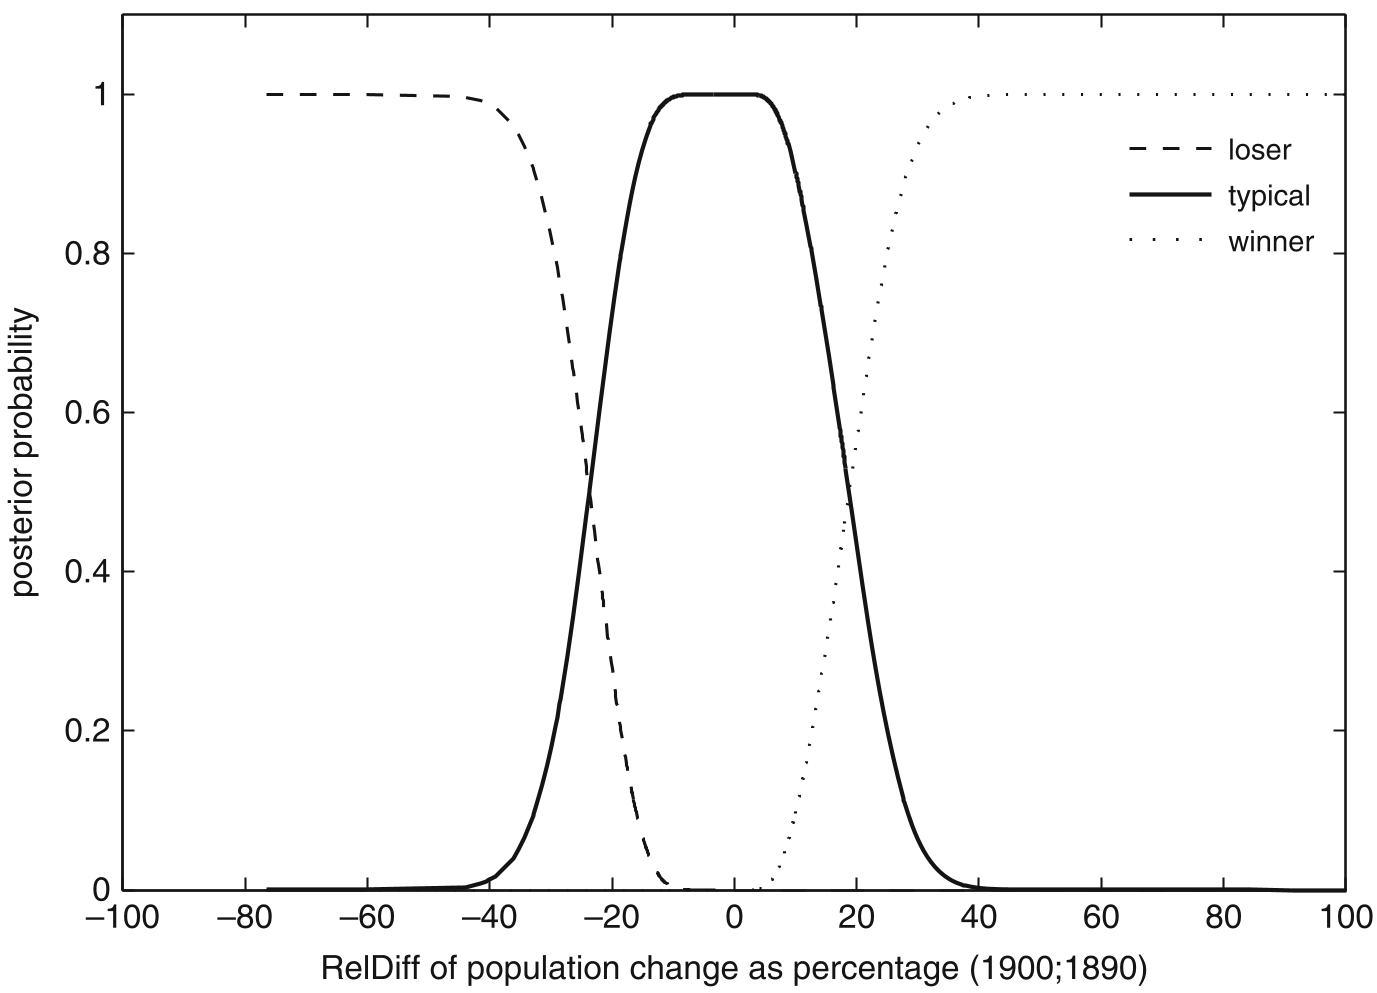
Instead of simple percentages, the authors used Relative Difference (RelDiff) to handle outliers. They modeled each decade as a mixture of three distributions:
- Losers: Communities with declining populations (Log-Normal).
- Typical: Communities following the Central Limit Theorem (Normal).
- Winners: High-growth communities (Log-Normal).
Using the EM algorithm and Bayes' theorem, every community was assigned a probability of belonging to one of these three classes for each of the 15 decades.
2. Identifying Relevant Knowledge
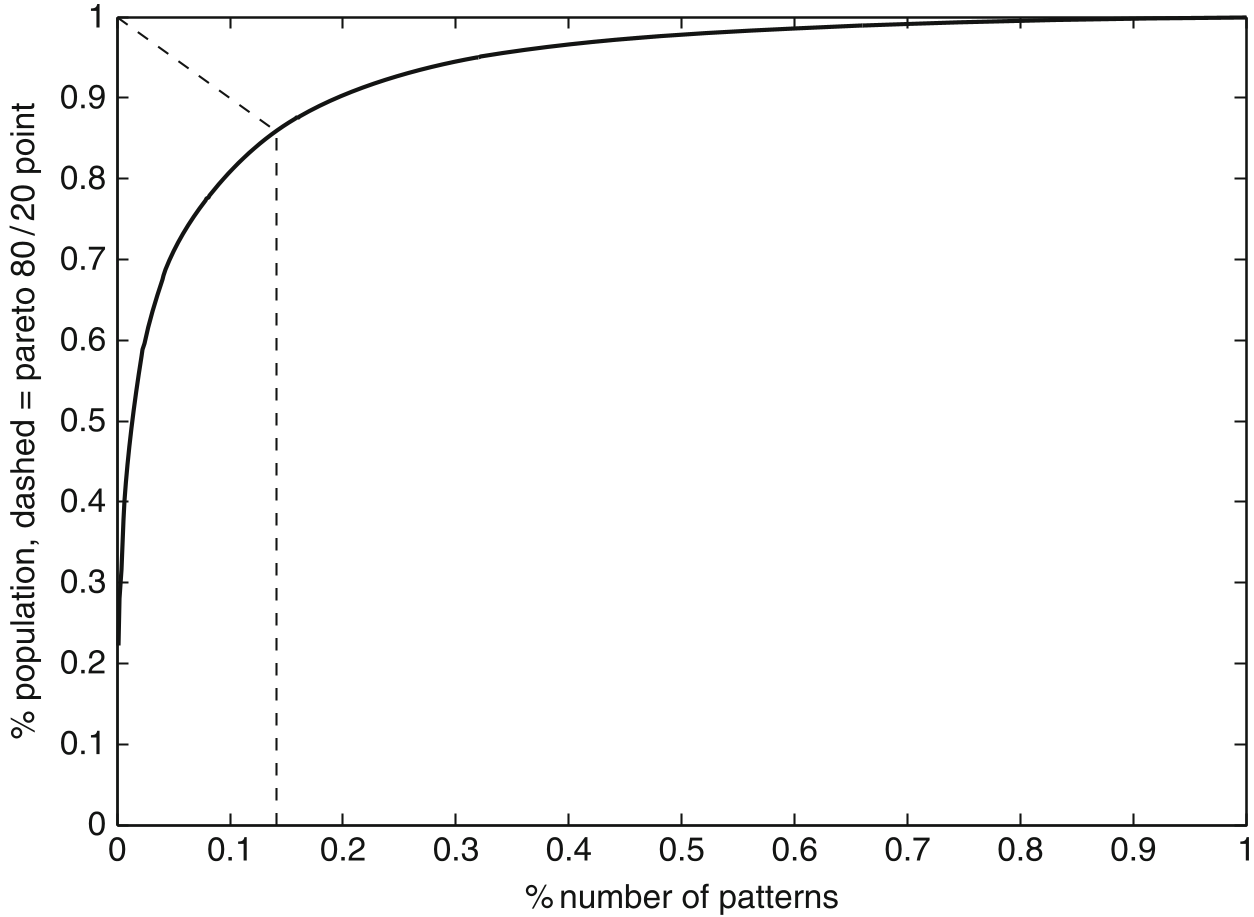
With 3 possible states over 15 decades ( potential combinations), the authors found 880 actual patterns in the data. To focus on what matters for planning, they used a Pareto-based information optimization (the 80/20 rule). This allowed them to isolate the 122 most "relevant" patterns that represent 85% of the total Swiss population.
Clustering: The Eight Faces of Switzerland
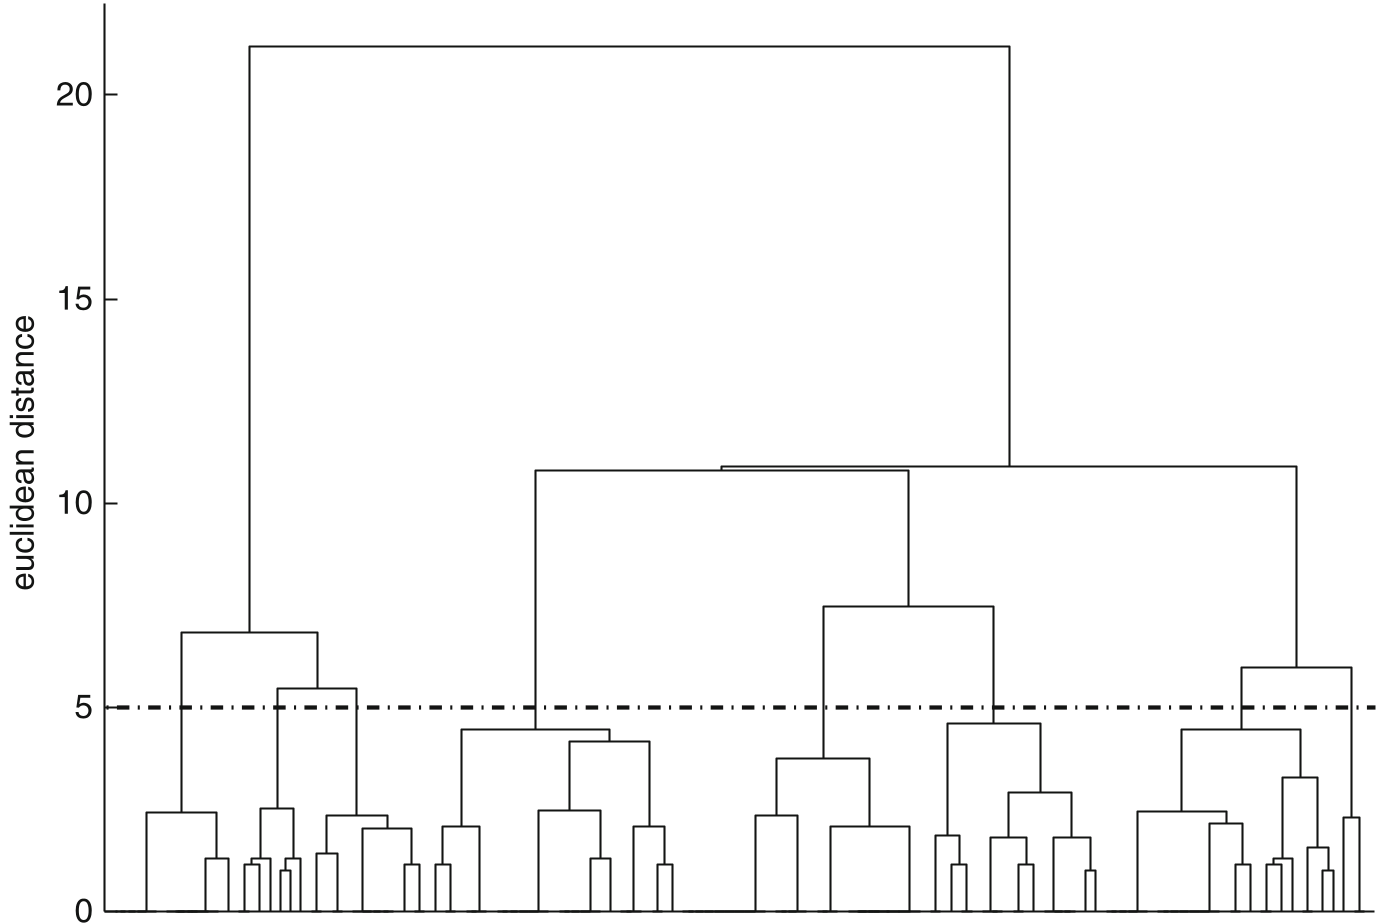
By grouping these relevant patterns into three major historical periods (Industrialization, World Wars, and the Post-War Boom), the authors applied Ward's clustering to reveal 8 clear typologies:
- Typical Swiss: The largest group, showing steady, average growth.
- Working Suburbia: Communities like Dietikon that won across multiple periods, particularly post-1950.
- Booming Suburbia: Late-bloomers that saw massive growth only in the modern era.
- High/Medium Dynamic Centers: The historical urban heartbeats of the 19th century.
Deep Insight: Beyond Geography
The value of this work is the "Knowledge Discovery" phase. By mapping these clusters (Fig. 5), the researchers could verify spatial abstractions against reality. They found that "Interwar Dynamic" communities like Ascona showed unique resilience, while "Early Urban Environs" displayed growth patterns established long before modern zoning.
Conclusion & Future Outlook
This paper proves that Data Mining can be a bridge between cold statistics and the "mental maps" of urban analysts. By quantifying 150 years of development into a manageable set of temporal signatures, it provides a blueprint for studying other regions experiencing rapid change.
Limitations: The study relies heavily on population as a proxy for development. Future work should integrate building data and infrastructure levels to see if the "Dynamic Centers" of the 1800s still hold the same structural influence today.
Takeaway: To understand where a city is going, you must look at its entire 15-decade signature, not just its last census.