
Mining Mobility: How Trajectory Clustering Bridges Virtual and Real-World Socializing
Clustering User Trajectories to Find Patterns for Social Interaction Applications
This paper introduces a framework for analyzing user mobility patterns to enhance social interactions in Location-based Social Networks (LBSNs). It utilizes an adapted OPTICS clustering algorithm to extract representative "daily routines" from GPS trajectories and a novel correlation algorithm based on Minimum Bounding Rectangles (MBR) and Hausdorff distance to identify potential social meeting points between users.
TL;DR
In an era where "socializing" often starts and ends on a screen, this paper explores how to bring people together in the physical world. The researchers present a system that analyzes GPS data to find patterns in our daily commutes, identifies "aggregated trajectories" using density-based clustering, and correlates these paths between friends to trigger real-world social interactions.
Background: The Gap Between Virtual and Physical Networks
The paradox of modern social networking is that while we are more "connected" than ever, physical community interactions are decreasing. Most Location-Based Social Networks (LBSNs) act as passive logs rather than active facilitators. The challenge lies in the sheer volume and noise of GPS data; turning thousands of raw coordinates into a "daily routine" requires sophisticated data mining.
The Problem: Turning Points into Patterns
Current methods often treat trajectories as static lines. However, human movement is dynamic—we might take three different routes to work depending on traffic or errands. To build an accurate "social profile," a system must:
- Filter Noise: Ignore the one-off trips and focus on habits.
- Aggregate Reality: Find the "typical" route from a month of various GPS tracks.
- Detect Proximity: Efficiently compare two complex paths to see if friends actually cross paths.
Methodology: Two Pillars of Trajectory Intelligence
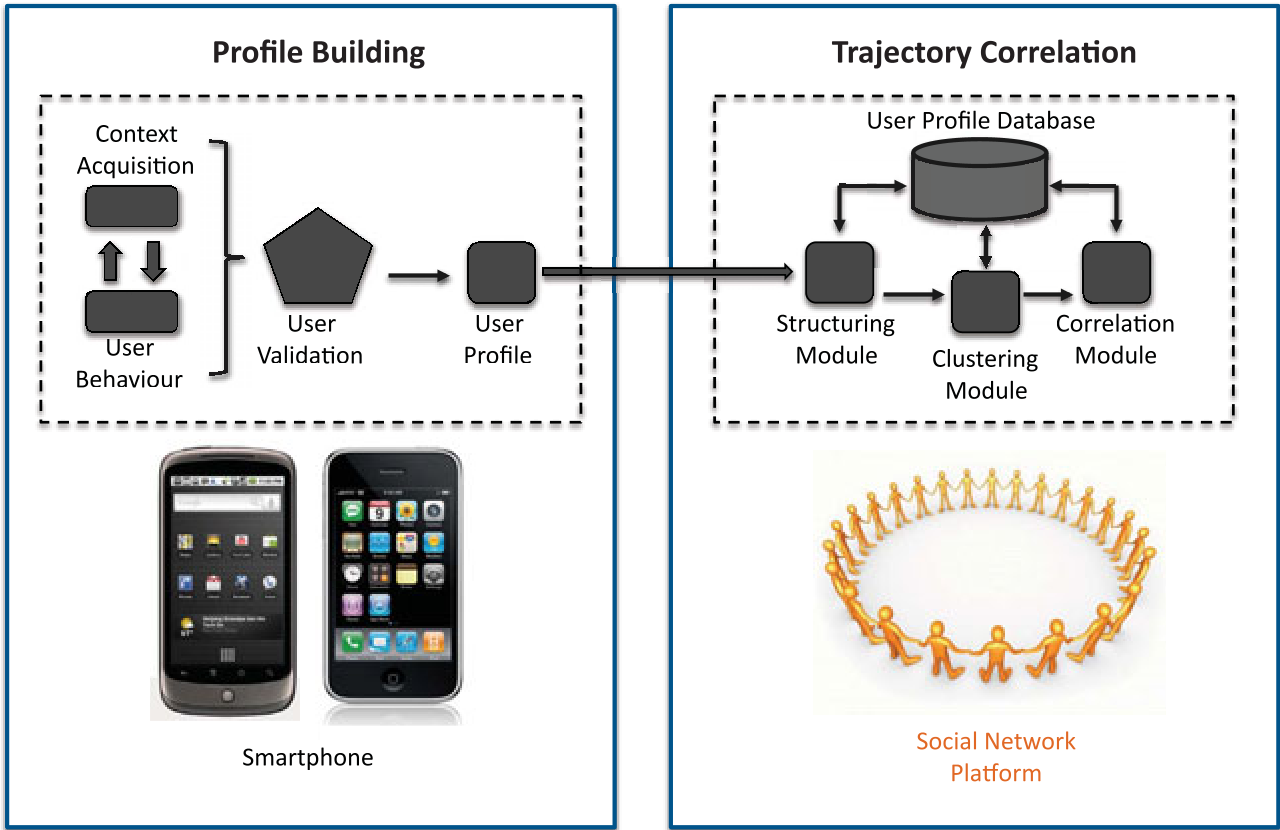
1. Profile Building & OPTICS Clustering
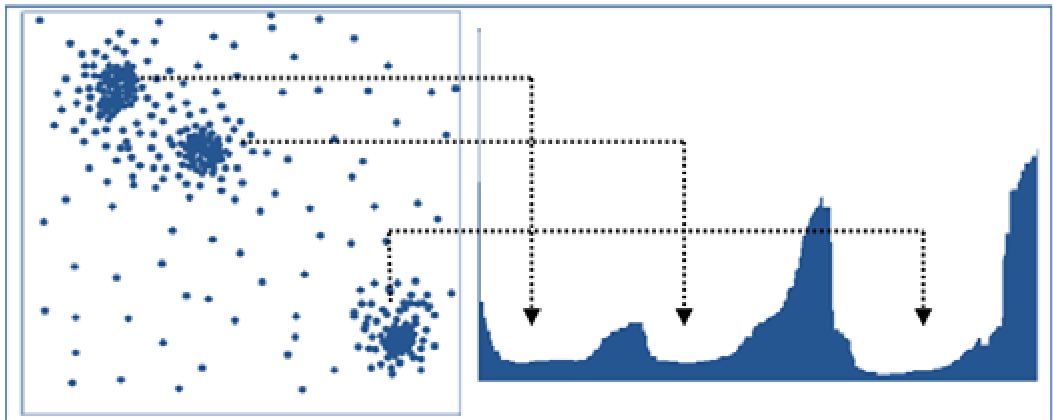
The authors adapted the OPTICS (Ordering Points To Identify the Clustering Structure) algorithm. Unlike K-means, OPTICS doesn't require a pre-defined number of clusters and is excellent at handling noise. It creates a "reachability plot," where valleys represent dense clusters of similar trajectories (e.g., your standard commute).
2. Trajectory Correlation with Hausdorff Distance
Once a "best representative" route is found for two users, the system needs to see if they overlap. Comparing every point on User A's path to every point on User B's path is computationally expensive.
- MBR Step: The system first draws a Minimum Bounding Rectangle (MBR) around each path. If the rectangles don't touch, the calculation stops immediately.
- Hausdorff Calculation: If the MBRs overlap, the system calculates the Hausdorff distance—the maximum distance of a set to the nearest point in the other set—specifically within the correlated area to identify how close the users actually get.
Experimental Results: Visualizing Habits
The researchers tested their approach on users over a one-month period. By setting the distance threshold (ε) to 1000m, they successfully separated regular commutes from occasional detours.
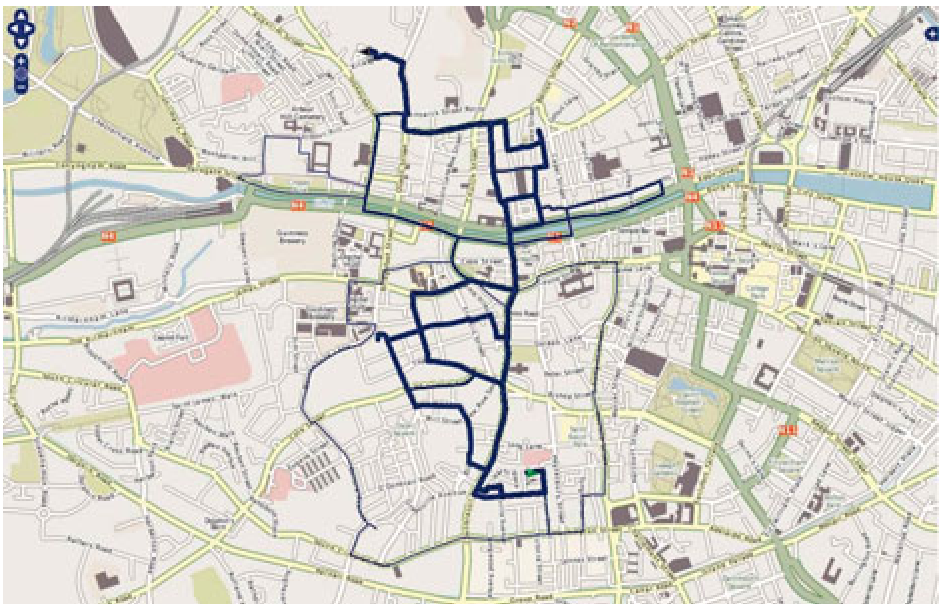
The system used a color-coded visualization to validate the correlation:
- Green: Same road segments (perfect overlap).
- Blue: Potential interaction points (within the correlated MBR area).
- Red: Out-of-range points.
This allowed the system to generate context-aware messages such as: "Your friend Reinaldo passes by your office every weekday between 10:00 AM and 10:30 AM."
Critical Analysis & Conclusion
Takeaway: This work demonstrates that trajectories are more than just coordinates; they are "behavioral data" that reveal our life patterns. By aggregating these patterns, we can create smarter applications for carpooling, tourism, and community building.
Limitations:
- Privacy: Sharing full trajectory data raises massive privacy concerns, which the authors acknowledge will require future study.
- Computational Expense: While MBR helps, calculating Hausdorff distances for thousands of users in real-time remains a scaling challenge.
Future Outlook: The next logical step is moving this processing to the mobile edge—performing the data mining locally on the phone to ensure privacy while still delivering social insights.