
EvolTrack: Decoding the Hidden Social Fabric of Software Engineering
An Exploratory Study on Collaboration Understanding in Software Development Social Networks
2012-01-01
Summary
Problem
Method
Results
Takeaways
Abstract
This exploratory study introduces EvolTrack-SocialNetwork, a tool designed to visualize and analyze collaboration in software development through technical, social, and socio-technical (ST) networks. By mining source code repositories, it maps dependencies to identify coordination patterns, achieving an average participant task accuracy of 82.5% in identifying team dynamics.
## TL;DR
Understanding how developers *actually* collaborate is often a "black box" for managers. This paper presents **EvolTrack-SocialNetwork**, a tool that mines version control repositories to visualize the interplay between source code dependencies and human team dynamics. By mapping code structures to social networks, the study demonstrates that we can objectively measure team coordination levels—from centralized leadership to highly distributed collaboration—using established mathematical metrics like density and centrality.
## The Problem: The Invisibility of Coordination
In modern software development, the "technical" (the code) and the "social" (the team) are inseparable. However, project managers often lack tools that show how technical dependencies dictate social interactions.
Prior work in **Social Network Analysis (SNA)** has long been used to study human relationships, but generic SNA tools fail to account for the specific nuances of software, such as:
* **Socio-technical Congruence**: Does the team structure match the software architecture?
* **Version Evolution**: How do collaboration patterns change between version 1.0 and 2.0?
* **Conflict Detection**: Who is working on the same file at the same time?
## The Methodology: From Repositories to Relationship Graphs
The core insight of the authors is the creation of three distinct but interconnected network types extracted from mining SVN/Git repositories:
1. **Technical Network**: A graph where nodes are code artifacts and edges are architectural dependencies.
2. **Socio-technical (ST) Network**: Links developers to the artifacts they edit, highlighting "authorship" and responsibility.
3. **Social Network (SN)**: Derived from the previous two, this network shows developer-to-developer links based on both **dependency** (working on related code) and **conflict** (working on the same code).
### Visualizing Peer Coordination
The tool identifies three coordination styles based on the **CollabMM** (Collaboration Maturity Model):
* **Centralized**: High centrality for one leader; low density.
* **Multiple**: Several hubs/link-nodes connecting small subgroups.
* **Distributed**: High density; balanced activities; no single point of failure.
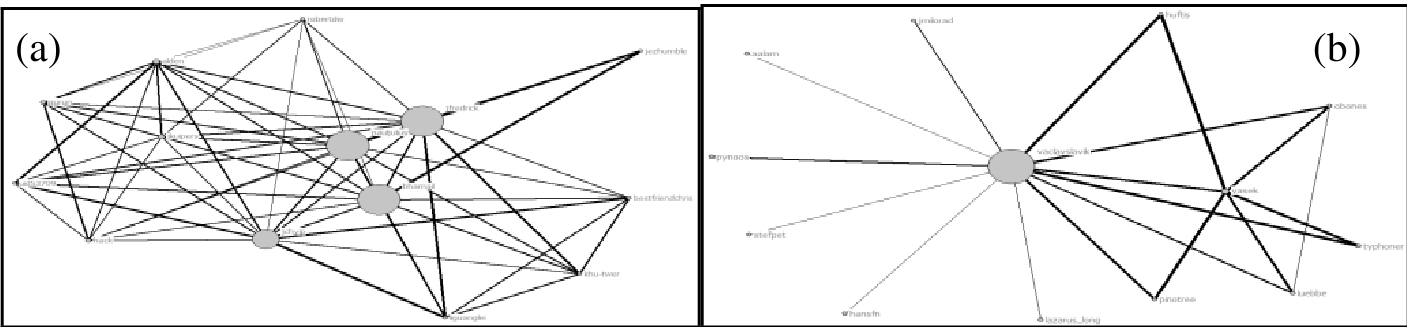
*Figure 1: The EvolTrack-SocialNetwork interface, showing the Social Network (a), Graphics Panel (b), and Analysis Metrics (e).*
## Experimental Insights: Validating the "Awareness"
The researchers conducted an exploratory study using the **TED (Torrent Episode Downloader)** open-source project. Four participants with backgrounds in collaboration research were tasked with answering 10 questions of varying difficulty (from simple filtering to complex interpretation).
### Key Findings:
* **Effectiveness**: Participants achieved an average of **82.5% accuracy**.
* **Insight Generation**: The tool was particularly effective at **Transfer Tasks**, such as deciding which developer to assign to a specific artifact or identifying where code refactoring might be needed due to high conflict density.
* **User Experience**: Rated as "Easy" to "Very Easy" to use, significantly facilitating task execution compared to manual log analysis.
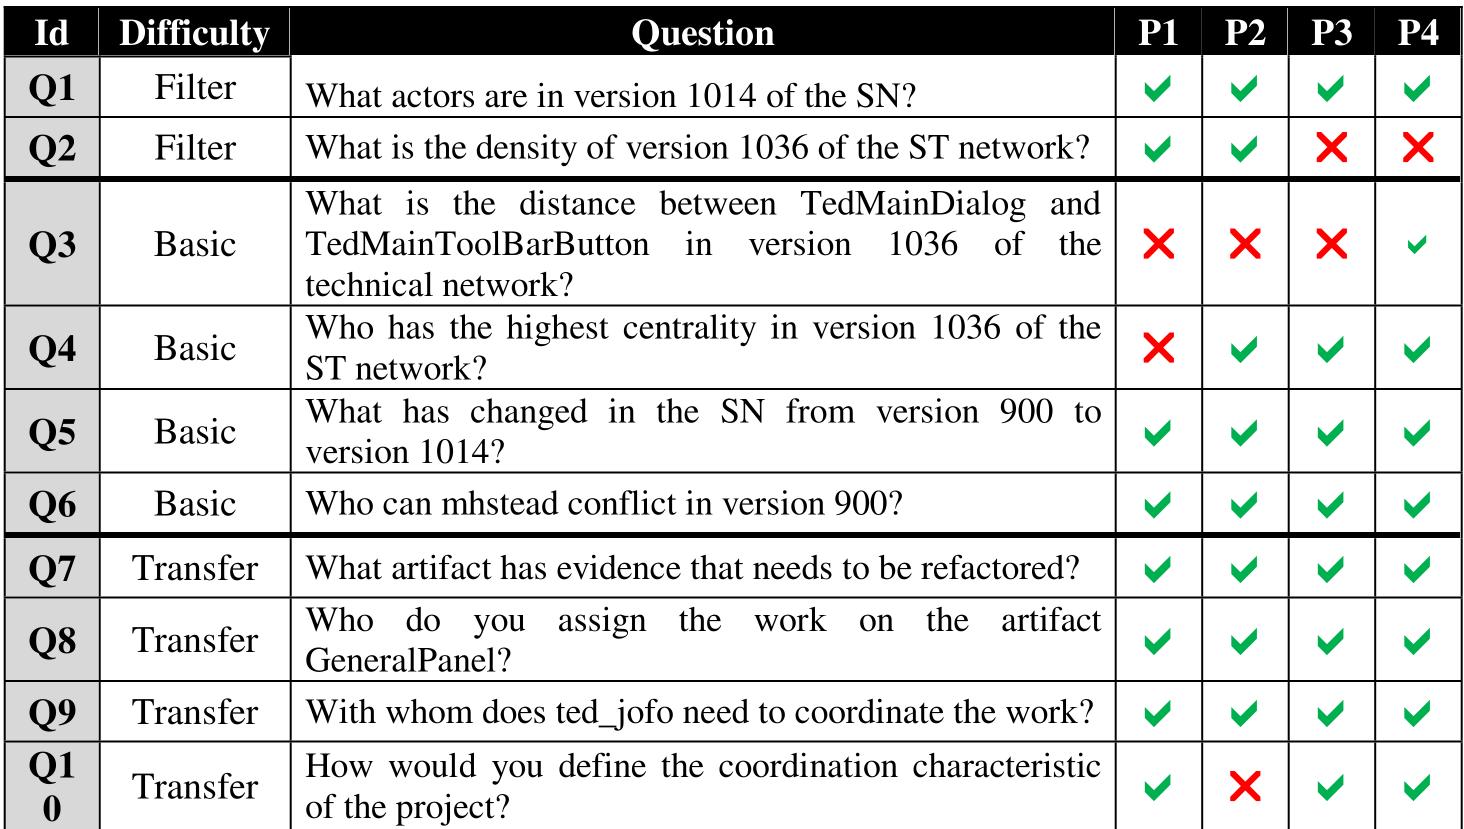
*Table 1: Task performance across different difficulty levels. Note the high success rate in transfer-level questions (Q7-Q9).*
## Critical Analysis & Future Outlook
While EvolTrack proves that social networks can make collaboration explicit, the study revealed two major hurdles:
1. **Complexity of Network Typing**: Humans still find it difficult to manually classify whether a network is "Distributed" or "Centralized" just by looking at the graph. The next step must be **Automated Coordination Classification**.
2. **The "Spaghetti" Graph Problem**: As projects grow to hundreds of developers and thousands of files, visualization becomes cluttered (the "Hairball" effect). Future iterations require **Clustering** and **Drill-down** features to maintain readability.
**Conclusion**: This research moves us toward a future where "Project Management" is less about intuition and more about the data-driven analysis of social and technical topologies.
---
**Reference**: Magdaleno, A. M., Araujo, R. M., & Werner, C. M. L. (2011). *An Exploratory Study on Collaboration Understanding in Software Development Social Networks.*