
Beyond Coauthorship: Quantifying the Depth of Human Collaboration
Collaborative Intensity in Social Networks
The paper introduces "Interlocking Communication" as a novel metric to measure collaborative intensity in social networks. By analyzing revision histories in corporate wikis, it moves beyond the traditional "width" of collaboration (number of coauthored papers) to incorporate "depth" (frequency and sequence of interactions).
TL;DR
Is a co-author on ten papers necessarily a closer collaborator than one you've spent 500 revisions debating a single masterpiece with? This paper argues "No." By introducing Interlocking Communication, the authors provide a mathematical framework to measure the depth of collaboration (interaction frequency) alongside its width (project count), revealing hidden structures in social networks that traditional metrics miss.
Problem & Motivation: The "Width" Trap
In the study of social networks, we typically represent the "strength" of a relationship—or collaborative intensity—as the weight of the tie between two nodes. For decades, researchers have relied on the Newman Approximation.
Newman's logic is intuitive: the more papers you co-author, the stronger your bond. However, this is often a "coarse assumption" born from data scarcity. Traditional datasets (like library catalogs) only show names on a finished product. They don't show the process.
The authors identify a critical flaw: traditional metrics favor Width (how many items you worked on) while ignoring Depth (how much you actually interacted during those items). In environments like wikis or software development, the "Revision History" is a goldmine of data that can fix this.
Methodology: Interlocking Communication
The core innovation is the concept of Interlocking Communication. Instead of looking at the final paper , the authors look at the revision history .
The Intuition
Imagine two histories:
- (Six turns of back-and-forth interaction)
- (Six edits, but zero interaction; B just finished what A started)
Traditional metrics treat and as identical. The authors' method counts the interlocks—instances where one person responds to another.
The Formal Framework
To capture the nuances of different organizational cultures, they propose a generalized formula for collaborative intensity ():
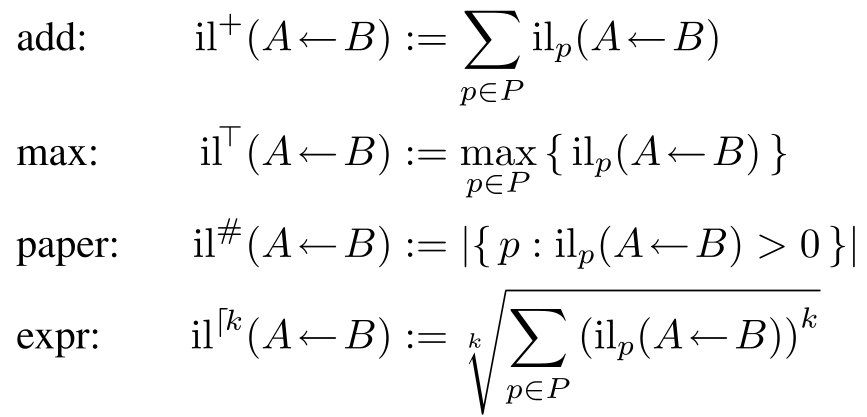
- (Add): Sums all interactions (Balances depth and width).
- (Max): Only cares about your most intense project (Focuses on depth).
- (Paper): Essentially the old way (Focuses on width).
- (Parametric): A tunable version where favors depth and favors width.
Experiments: Seeing the Invisible Triads
The researchers tested their metrics across four diverse "Wiki" environments: a Startup, a Research Center, a News Agency, and a Student Group.
Visual Evidence
By keeping the node positions constant and only varying the tie-weight calculation, they produced a striking comparison:
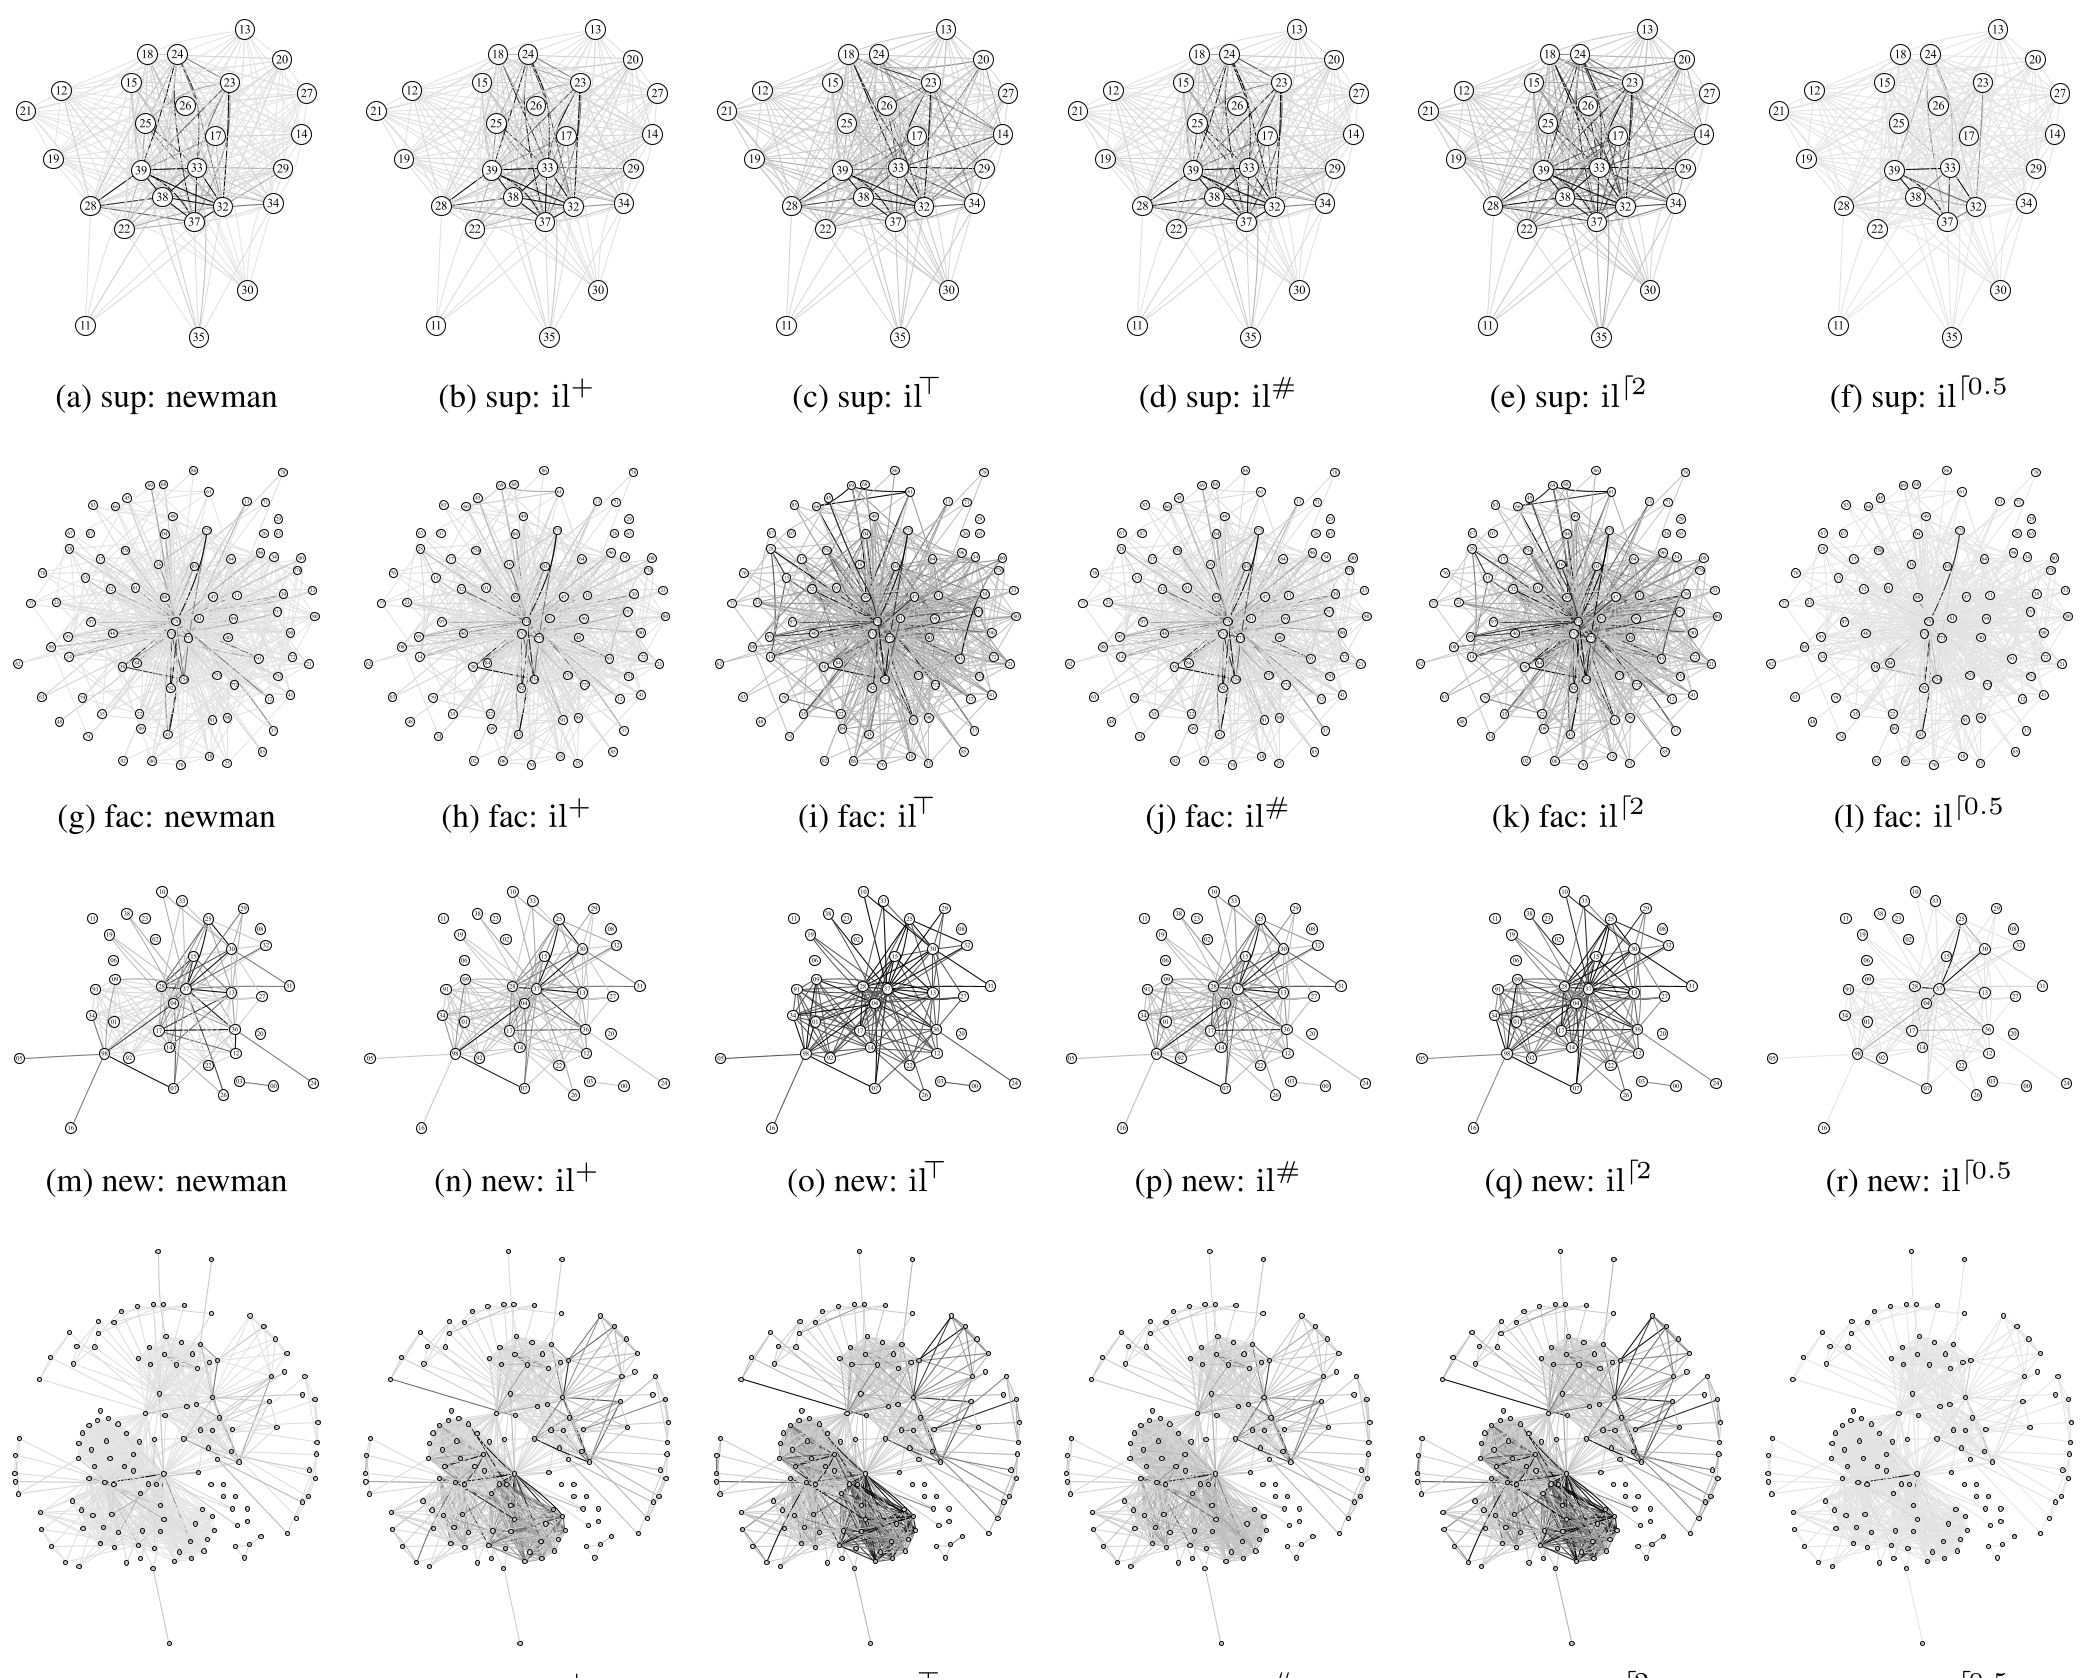 Figure 1: Notice how in Figure 1i (favoring depth), certain "triads" in the upper periphery become much darker. These represent groups working intensely on single pages—interaction that the Newman approximation (1g) fails to highlight.
Key Findings
- Metric Sensitivity: In the "Students Wiki" (intense work on few documents), the ranking of "important" collaborators shifted by over 16% compared to traditional methods.
- Network Topology: High-depth metrics reveal "Tightly-integrated" sub-communities that appear "loosely-coupled" when only looking at publication counts.
| Wiki Type | Tie Rank Offset (il Max) | Interpretation |
|---|---|---|
| Startup | 14.2% | High interaction across many topics. |
| Students | 16.3% | Intense "sprints" on single topics. |
Critical Analysis & Conclusion
This paper serves as a wake-up call for Social Network Analysis (SNA). As we move into an era of "Big Data" where every keystroke can be logged (GitHub, Slack, Notion), continuing to use 20-year-old coauthorship approximations is a missed opportunity.
Takeaway: The "Interlocking Communication" model is a superior lens for analyzing modern digital collaboration. It allows us to distinguish between co-occurrence and collaboration.
Limitations: The model ignores the size of the contribution (amount of text added) to focus purely on the interaction. While intentional, combining interaction sequence with contribution volume could provide an even more holistic "Collaborative Energy" metric.
Future Outlook: As AI agents join human teams, measuring "interlocking" between humans and LLMs (e.g., in Copilot sessions) could become the standard for assessing human-AI synergy.