
Predicting the Unpredictable: Why Change Rates Rule Community Evolution
Community evolution prediction in dynamic social networks using community features' change rates
This paper introduces a novel approach for predicting community evolutionary events (e.g., merge, split, dissolve) in dynamic social networks by utilizing the "change rates" of community features instead of absolute values. Tested on DBLP and Facebook datasets, the method achieves high accuracy in forecasting the next stage of a community's life-cycle using structural and leadership-based metrics.
TL;DR
Predicting the future of social groups—whether they will grow, merge, or dissolve—is notoriously difficult. This paper argues that how fast a community is changing is a much better predictor than its current size or density. By focusing on the "change rates" of structural features and leader influence, the authors significantly improved the accuracy of evolution forecasting on major datasets like DBLP and Facebook.
Background: The Pulse of Social Dynamics
Dynamic social networks are living organisms. Members join, leave, and form sub-groups constantly. In research terms, we track these through eight primary events: Birth, Death, Growth, Contraction, Merge, Split, Survive, and Resurgence.
Existing SOTA methods usually look at a "snapshot" of a community—its density, number of edges, or leadership score—and try to guess what happens next. The problem? A community with 50 members that just grew from 10 is in a very different state than a community of 50 that just shrank from 200. Absolute values hide this critical "momentum."
The Core Insight: From Position to Velocity
The authors propose a shift from "positional" data to "velocity" data. By calculating the Rate of Change for features between time and , they provide classifiers with a vector of growth or decay.
Methodology: Tracking the 10 Vital Signs
The approach involves four distinct stages:
- Community Discovery: Using the Clique Percolation Method (CPM) to find overlapping communities.
- Feature Extraction: They track 7 structural features (Size, Density, Cohesion, Clustering, and Centralities) and 3 leader-specific features (Degree, Closeness, and Eigenvector centrality of the top 20% of members).
- Evolution Tracking: Using the Group Evolution Detection (GED) method to label what actually happened between snapshots.
- The Change Rate Formula:
 Note: The process involves snapshotting, feature calculation, and multi-step sequence formation.
Experimental Battleground: DBLP vs. Facebook
The researchers tested their hypothesis on two very different environments:
- DBLP (Academic Collaboration): Stable, long-term, and larger communities.
- Facebook (Wall Posts): Highly volatile, small communities, and fast-paced interactions.
Key Results: Change Rates Win
Comparing the "Absolute Value" approach (Scenario A) against the "Change Rate" approach (Scenario B), the results were clear:
| Snapshot Length (p) | Event | Baseline (F-Measure) | Proposed (F-Measure) |
|---|---|---|---|
| p=5 (DBLP) | Survive | 0.804 | 0.917 |
| p=7 (Facebook) | Merge | 0.563 | 0.792 |
The F-measure improved across nearly all event types. Interestingly, "Split" events proved the easiest to predict (reaching F-measures above 0.90 in some cases), likely because the internal fragmentation of a community leaves a very specific "change signature" in its cohesion and density metrics.
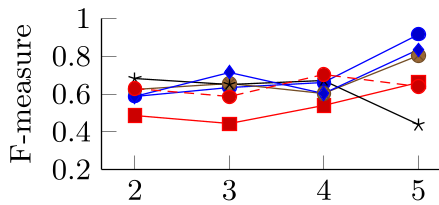 Experimental results showing F-measure trends across different sequence lengths for the DBLP dataset.
Deep Insight: Which Features Actually Matter?
The study used a "wrapper method" to identify which features were doing the heavy lifting.
- The Power of Size: The initial size of a community is almost always a relevant anchor.
- The Survival Signal: For a community to Survive, the centrality of its leaders and its internal cohesion are the strongest indicators.
- The Split Signal: Dramatic changes in the Clustering Coefficient and Cohesion Rate are the "canaries in the coal mine" for a community about to fragment.
Critical Analysis & Future Outlook
Contribution: The paper successfully proves that the temporal trajectory of community features is more informative than the features themselves. This simplifies the prediction task by focusing on trends rather than high-dimensional absolute states.
Limitations:
- Data Scarcity: As the researchers looked deeper into the past (longer sequences), the number of available samples dropped significantly, causing some classifiers to fail or lose accuracy.
- Contextual Blindness: The model only looks at structure. It doesn't know what the people are talking about (using NLP) or why they are leaving.
The Takeaway for Practitioners: If you are building a community management tool or a churn prediction system for social platforms, don't just look at how active a user or group is today. Look at the slope of their activity. A stable small group is safer than a large group with a declining cohesion rate.
Conclusion
This work provides a robust framework for understanding the "life and death" of online groups. By treating community evolution as a sequence of dynamic shifts rather than a series of static images, we get closer to truly predictive social analytics.