
Benchmarking NAM Estimators: Why Your Social Influence Estimates Might Be Biased
A comparison of estimators for the network autocorrelation model based on observed social networks
This paper presents a comprehensive simulation study comparing Maximum Likelihood (MLE), Two-Stage Least Squares (TSLS), and three Bayesian estimators for the Network Autocorrelation Model (NAM). It utilizes realistic network topologies generated via Exponential Random Graph Models (ERGM) based on observed social networks (Add Health data) to evaluate point estimation performance (bias, variance, and MSE) and interval coverage.
TL;DR
Estimating social influence using the Network Autocorrelation Model (NAM) is notoriously tricky. This study reveals that the standard Maximum Likelihood (MLE) approach consistently underestimates network effects in realistic, sparse social networks. Through an extensive simulation using ERGM-generated realistic topologies, the authors demonstrate that a Bayesian approach with a weakly informative prior is the most robust choice for practitioners, balancing bias reduction with reliable interval coverage.
The Hidden Trap in Social Influence Modeling
In social network analysis, we often want to know if an individual's behavior (like drug use or academic performance) is influenced by their peers. The Network Autocorrelation Model (NAM) is the mathematical workhorse for this, adding a "network effect" parameter to standard regression.
However, researchers have long suspected a "negative bias" in how we estimate . Most previous evidence came from toy models (like random graphs) that don't look like real human societies. Real networks are sparse, transitive (friends of friends are friends), and exhibit reciprocity. This paper finally puts these estimators to the test in the "real world" of complex topologies.
Methodology: Bringing Realism to Simulations
The authors didn't just use random noise. They took 22 real-world friendship networks from the Add Health dataset and fit them using Exponential Random Graph Models (ERGM). By sampling from the posterior predictive distribution of these ERGMs, they created thousands of synthetic networks that retain the "DNA" of actual social structures.
They compared five distinct estimators:
- MLE (Maximum Likelihood): The industry standard.
- TSLS (Two-Stage Least Squares): Often used for its speed.
- Bayesian (Strong Prior): Uses meta-analysis data to guide the estimate.
- Bayesian (Weak Prior): Provides light regularization.
- Bayesian (Flat Prior): Ideally mirrors the MLE.
The Core Breakthrough: Architecture of the Comparison
The study evaluated these tools across varying network sizes ( to ) and densities.
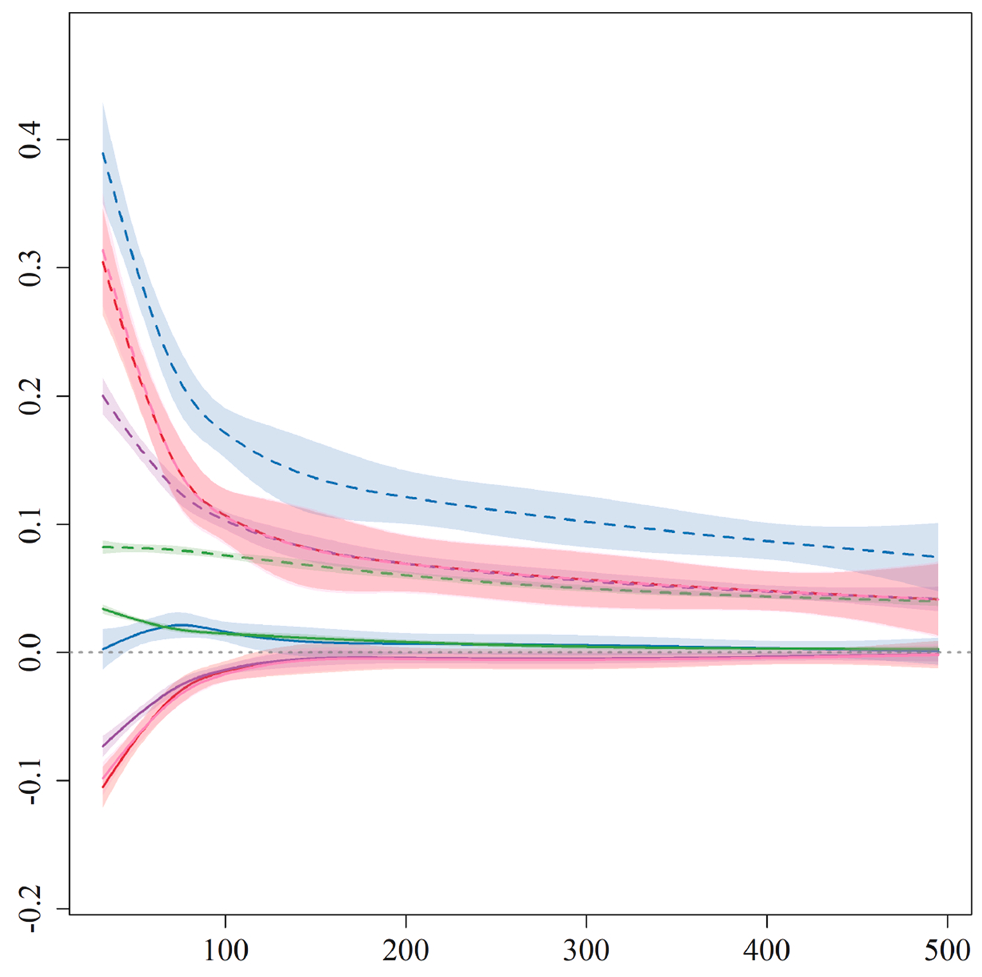 Figure 1: Comparison of Bias and Standard Deviation across three different true values of . Notice how the MLE (red) consistently dips below the true value, especially in smaller networks.
Key Findings:
- The Size Threshold: Point estimation is highly unstable in networks with fewer than 100 actors. Beyond 125-200 actors, most estimators stabilize, though the negative bias in MLE persists.
- The TSLS Paradox: TSLS was the only estimator that was "unbiased" on average. However, it had such high variance and wide confidence intervals that it becomes practically useless for small-scale social studies unless speed is the only concern.
- The Bayesian Advantage: The weakly informative prior () acted as a stabilizer. It reduced the Mean Squared Error (MSE) significantly compared to MLE, especially in the sparse networks typical of real social interactions.
Visualizing the Trade-offs
The study highlights a critical trade-off between precision (variance) and reliability (coverage).
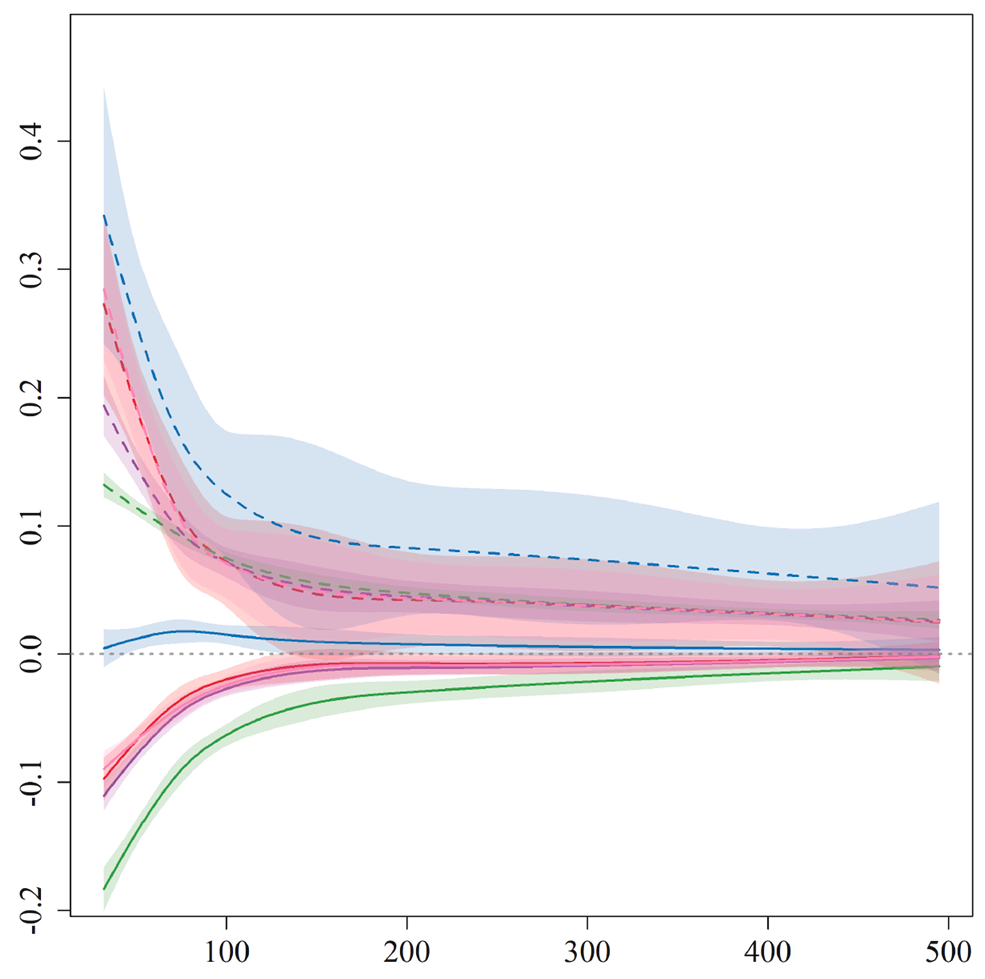 Figure 2: Coverage rates of 95% intervals. While the Strong Prior (green) fails to cover the truth when it deviates from the prior mean, the Weak Prior (blue) matches the frequentist coverage while maintaining narrower intervals.
Critical Insight: The Density Problem
A major contribution of this work is the analysis of Network Density. Previous studies looked at densities up to 0.95 (nearly fully connected), but real social networks usually hover around 0.03. The authors found that as density increases, both the magnitude of the bias and the variance of the estimators increase. This confirms that the more "interconnected" a group is, the harder it is for standard statistical tools to untangle individual effects from network influence.
Practical Recommendations
- For Small Networks (): Stop using MLE. The negative bias is too pronounced. Use a Bayesian estimator with a weakly informative prior to "nudge" the estimate toward a more realistic range.
- For Large Networks: TSLS becomes viable because its high variance decreases, and its computational speed allows for processing thousands of nodes where MLE/Bayesian methods might crawl.
- The "Weak Prior" is King: It provides the best frequentist properties—low MSE and accurate 95% interval coverage—while benefiting from Bayesian regularization.
Conclusion
This paper serves as a much-needed course correction for social network researchers. By proving that the topological "realism" of a network significantly impacts how we should estimate social influence, the authors provide a clear roadmap: when in doubt, regularize.
Limitations: The study is based on friendship networks. Whether these findings hold for different types of networks (e.g., corporate hierarchies or biological protein-protein interactions) requires further validation.