
Graph Privacy Benchmarking: Why Facebook is Harder to Protect than Enron
A Comparison of Two Different Types of Online Social Network from a Data Privacy Perspective
This paper presents a comparative privacy analysis of two distinct Online Social Networks (OSNs)—Facebook (user interactions) and Enron (corporate emails)—by modeling them as graphs. Using a random link addition perturbation method, the study evaluates the trade-off between Information Loss and Risk of Disclosure based on topological features like Degree, Clustering Coefficient (CC), and Average Path Length (APL).
TL;DR
Not all social networks are created equal when it comes to privacy. This study compares a Facebook interaction log with the Enron email corpus to show that sparse networks (Facebook) lose their analytical value much faster than dense networks (Enron) when anonymized. The researchers found that while adding random links effectively hides identities, it can trigger up to a 27% loss in data utility for platforms like Facebook, compared to only 7.7% for corporate email networks.
Problem & Motivation: The Structural Privacy Trap
When researchers publish social network data, they often use simple anonymization (removing names). However, an attacker with "neighborhood knowledge"—knowing a target has 50 friends and a specific clustering coefficient—can easily re-identify individuals.
The core challenge addressed here is: Does the same anonymization method work the same way across different types of networks? The authors suspect that the inherent "topological DNA" of a network (how many people talk to each other and how closely) dictates how much privacy you get for every bit of data utility you sacrifice.
Methodology: Probing the Graph Topology
The authors modeled the datasets as undirected graphs and focused on three "Derived Factors" that serve as fingerprints for nodes:
- Degree: The total number of links to a node.
- Clustering Coefficient (CC): How many of your friends are also friends with each other.
- Average Path Length (APL): The average number of "hops" to reach any other node in the network.
The Perturbation Experiment
The team applied Random Link Addition. If you have a 25% perturbation, it means 25% of the nodes had one random new link attached to them. They then measured:
- Information Loss: How much the correlations between Degree, CC, and APL shifted compared to the original graph.
- Risk of Disclosure: The probability that an attacker query (searching for specific Degree/CC/APL values) would successfully find the original node among a small set of candidates.
| Dataset | Avg Degree | Avg Clustering Coefficient | Avg Path Length |
|---|---|---|---|
| Enron | 31.03 | 0.1556 | 3.15 |
| 5.08 | 0.0257 | 6.00 | |
| The stark difference in average degree (31 vs 5) is the engine behind the experimental results. |
Experiments & Results: Density is a Shield
The study revealed a fascinating disparity in how these networks "break" under perturbation.
1. The Utility Gap (Information Loss)
Facebook's Information Loss was consistently higher. At 100% perturbation, Facebook reached 27.4% loss, while Enron only reached 7.7%.
Reasoning: In a dense network like Enron (avg degree 31), adding one extra link is a "drop in the ocean." In a sparse network like Facebook (avg degree 5), adding one link significantly alters the node's local topology, destroying the graph's original statistical integrity.
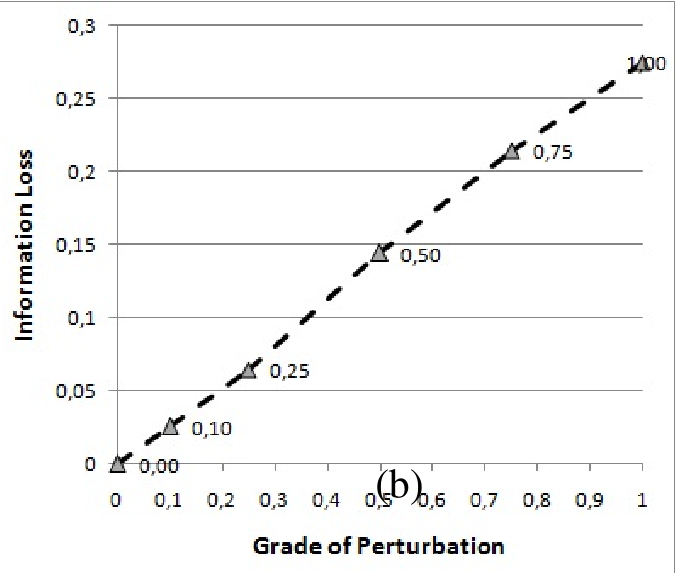 Fig 1: Information Loss vs. Perturbation. Note the steeper gradient for Facebook (b) compared to Enron (a).
2. The Sensitivity of Average Path Length (APL)
The risk of disclosure dropped sharply for both, but the inclusion of APL in an attacker's query changed everything. For Facebook, the risk dropped to nearly zero at just 50% perturbation when APL was used as a criterion.
Insight: APL is highly sensitive to random links. Adding one link can create a "shortcut" that drastically reduces the distances across the graph, making the original APL a very poor identifier after the graph has been tampered with.
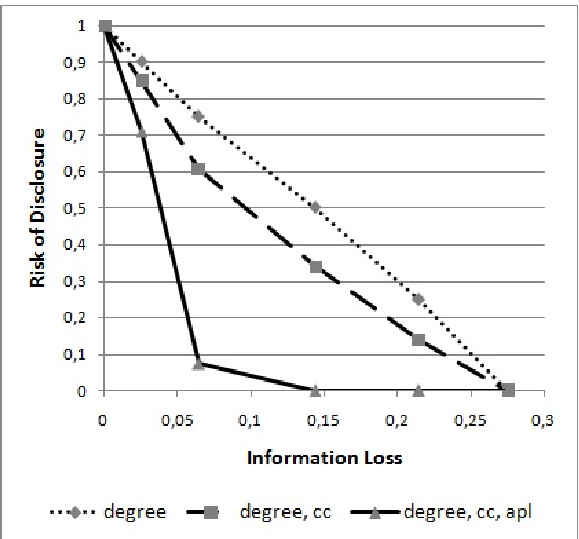 Fig 2: Risk drops faster in Facebook (a) than Enron (b) because structural changes are more "noisy" in sparse networks.
Critical Analysis & Conclusion
Takeaway
The paper proves that network density is a natural buffer for data utility. If you are managing a dense corporate network, you can afford to add significant perturbation to protect privacy without ruining your data's research value. For sparse social networks, random link addition is a double-edged sword: it provides excellent privacy but quickly renders the data statistically useless.
Limitations
- Simple Attack Model: The study assumes an attacker looks for exact values within a 1% margin. More sophisticated machine learning-based attacks might deanonymize nodes even with higher perturbation.
- Homogeneous Perturbation: The method adds exactly one link. Real-world privacy-preserving algorithms might need to add links proportional to the node's degree (Differential Privacy approach).
Future Outlook
This work lays the groundwork for Adaptive Anonymization. Future tools should automatically scan the average degree and clustering coefficient of a graph and suggest a "perturbation budget" that balances the specific risk-utility trade-offs of that unique topology.