
Decoding Social Complexity: Why Your Social Network is More Random Than You Think
The complexity of social networks: theoretical and empirical findings ଝ
This paper explores the application of algorithmic complexity, specifically the Lempel-Ziv (L-Z) measure, to social network analysis. By examining both theoretical expanded blockmodels and 112 empirical datasets, the study evaluates the degree of reducibility in social structures and characterizes their structural complexity relative to random graph baselines.
TL;DR
Is social structure inherently "simple" because of human cognitive limits and organizational roles? Using Algorithmic Complexity (Kolmogorov-Chaitin), this paper discovers a surprising truth: most social networks are almost as complex as random noise. While theoretical models of roles (blockmodels) are highly compressible, real-world data largely follows the Conditional Uniform Graph Distribution, meaning much of what we call "structure" is just a byproduct of network size and density.
The Intuition: Reducibility vs. Complexity
In the world of social science, we love "blockmodels." We take a messy group of 100 people and say, "These 10 are Managers, these 90 are Workers." This is a form of Data Compression. If a network can be perfectly described by a few roles, its algorithmic complexity should be very low—you only need a short "program" to recreate the graph.
The author, Carter T. Butts, asks a fundamental question: Are social networks actually algorithmically simple? Or are we just finding patterns in the noise?
Methodology: Bringing Lempel-Ziv to Graphs
To measure this, Butts translates a graph's adjacency matrix into a binary string (arc encoding). He then applies the Lempel-Ziv (L-Z) measure, the same logic used in ZIP files, to calculate how much "innovation" or randomness is in the network.
One major hurdle is Labeling Invariance. If you rename the nodes, the binary string changes, and so does the complexity.
- Structural Complexity (): The minimum complexity achieved across all possible permutations of the graph.
- Kaspar-Schuster Algorithm: Used to compute these values efficiently ().
 Figure 1: Two isomorphic structures. Structure A looks simple (blocked), while B looks complex. The method seeks the 'minimal' representation to find true structural complexity.
The Virtual Experiment: Testing the Tool
Before hitting real data, Butts ran a "virtual experiment." He created "Expanded Blockmodels"—graphs with perfect structural equivalence hidden inside.
- Result: These models were extremely compressible (Complexity ~25% of maximum).
- The Catch: Even small amounts of noise (5-10%) or random permutations quickly ballooned the complexity back toward the random limit. This suggests that the L-Z measure is a powerful, yet sensitive, detector of "clean" structural patterns.
Empirical Findings: The Reality Check
The paper analyzes 112 networks across three categories:
- Observational/Behavioral: Third-party recorded interactions.
- Self-Report: "Who are your friends?"
- Cognitive Social Structures (CSS): One person's perception of the whole network.
1. The Simple Network Hypothesis: REJECTED
The hope was that social networks would be substantially simpler than random graphs. In reality, most networks hugged the 95% confidence interval of the Random Baseline.
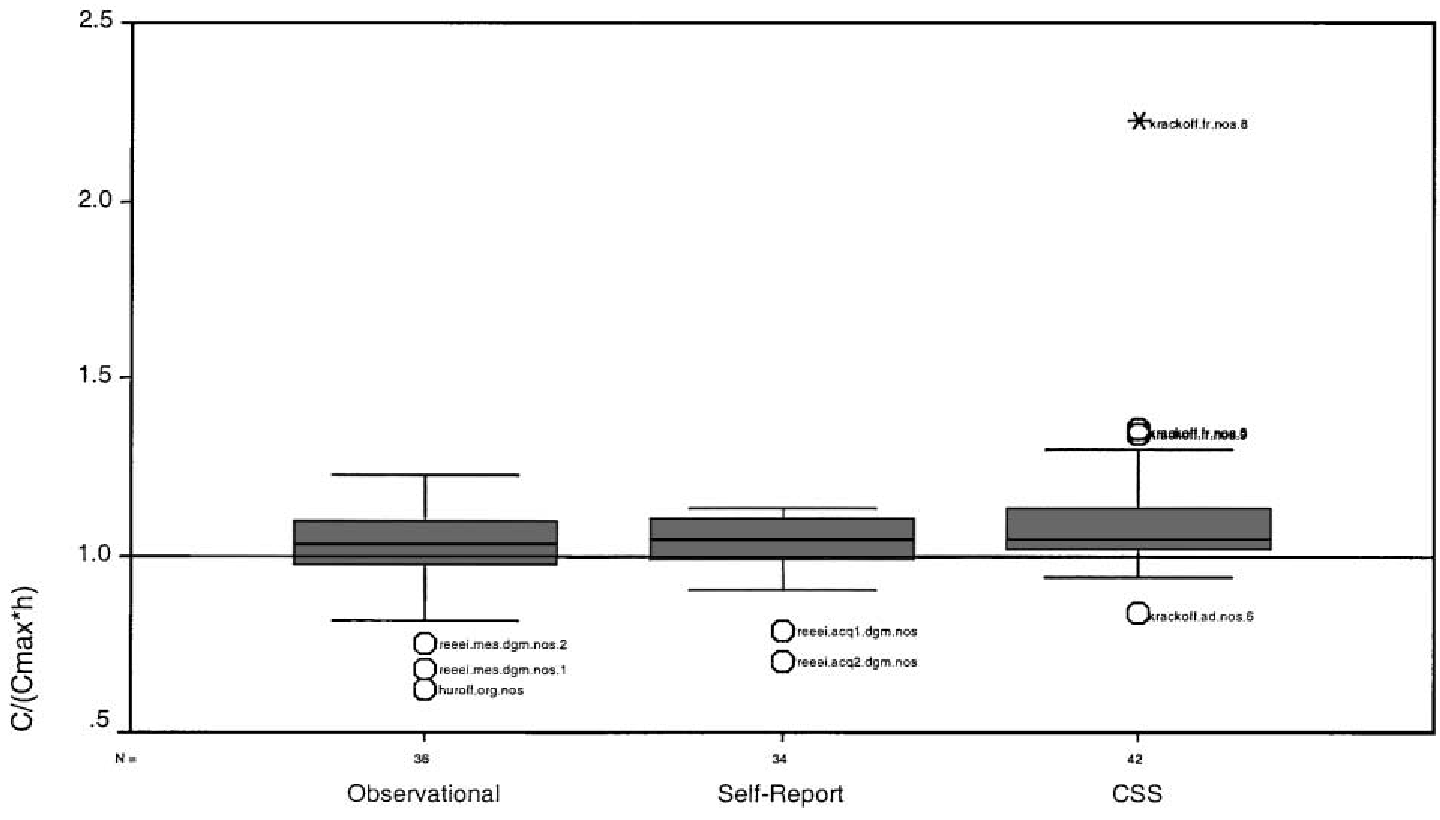 Figure 2: Distribution of normalized complexity. Note how few values fall below 0.7; most are concentrated near the random limit of 1.0.
2. The Cognitive Representation Hypothesis: FAILED
Surprisingly, Cognitive Social Structures (CSS)—which we assumed would be simplified by human memory biases—were more complex relative to random baselines than observational networks. This suggests human mental maps of social circles are remarkably detailed (or at least, remarkably messy).
Critical Insight: The Shadow of Density
The most profound takeaway is that Source Entropy (Density) is the master variable. A very sparse or very dense network is "simple" only because there aren't many ways to arrange the ties. Once you control for density, social networks look a lot like Conditional Uniform Graphs.
Why does this matter? If social networks are nearly random (conditional on density), then our algorithms for finding "approximate equivalence" might be finding "phantom structures"—patterns that would appear in any random graph of that size.
Conclusion
This paper serves as a rigorous warning to the network science community. While social life feels structured and governed by roles, its mathematical representation is often indistinguishable from high-entropy noise. Complexity measures provide a necessary filter: if a network’s Lempel-Ziv score isn't significantly lower than a random baseline, we might be over-interpreting our data.
Future Outlook: The "unlabeled" complexity approach opens a new door for comparing graphs without being blinded by node labels, potentially leading to better benchmarks for graph-based machine learning.