
Contrasting Temporal Trends: Unveiling Hidden Subgroup Dynamics in Healthcare Big Data
c o m p u t e r m e t h o d s a n d p r o g r a m s i n b i o m e d i c i n e 1 1 3 ( 2 0 1 4 ) 251-257
This paper introduces a novel visual analytics framework for discovering and comparing temporal trends in large-scale healthcare data. By integrating Aprior-based association rule mining with model-based recursive partitioning, the authors provide a method to identify significant patient subgroups (e.g., by age and gender) and visualize their unique linear trends via regression trees.
TL;DR
In the era of Big Data, healthcare analysts often miss the "forest for the trees"—or more accurately, the specific clusters of trees within the forest. This research presents a hybrid approach combining Apriori-based association rule mining and model-based recursive partitioning to detect temporal trends within distinct patient subgroups. By analyzing 10 years of US hospital data (~65 million records), the authors demonstrate that what looks like a flat trend at the population level often masks significant, opposing shifts in specific age and gender cohorts.
Problem & Motivation: The Mirage of the Population Average
Why is traditional trend discovery failing? Most analytical tools used by hospital management or insurance companies look at global trends. However, medical conditions are highly stratified. A policy that works for 20-year-olds might be irrelevant for 70-year-olds.
The authors identified a gap: we need a way to automatically segment the population into groups where the "trend" is statistically distinct. The challenge is twofold:
- Finding meaningful associations between multiple diagnoses (Association Rule Mining).
- Statistically proving where a population should be "split" to reveal localized trends (Recursive Partitioning).
Methodology: The Hybrid Discovery Pipeline
The authors' workflow (captured in their methodology) moves from raw clinical codes to intuitive visual trees.
1. Association Rule Mining (The "What")
Using the Apriori algorithm, the system identifies co-occurring diagnoses. For example, if a patient has Hypertension and Esophageal Reflux, how likely are they to also have Hyperlipidemia? This is expressed as X ⇒ Y (Antecedent ⇒ Consequent).
2. Model-Based Recursive Partitioning (The "Who" and "When")
This is the core innovation. Instead of a standard decision tree that predicts a class, this Regression Tree splits the data based on where the linear model parameters become unstable.
- Partitioning Variables: Factors like Age and Gender.
- Regressor: The Time element (Quarter or Month).
- Dependent Variable: Interest measures like Support, Confidence, or Chi-square ().
Experiments & Results: The Discovery of Opposing Trends
The researchers applied this to the Nationwide Inpatient Sample (NIS), focusing on major diagnoses like Hypertension and Hyperlipidemia.
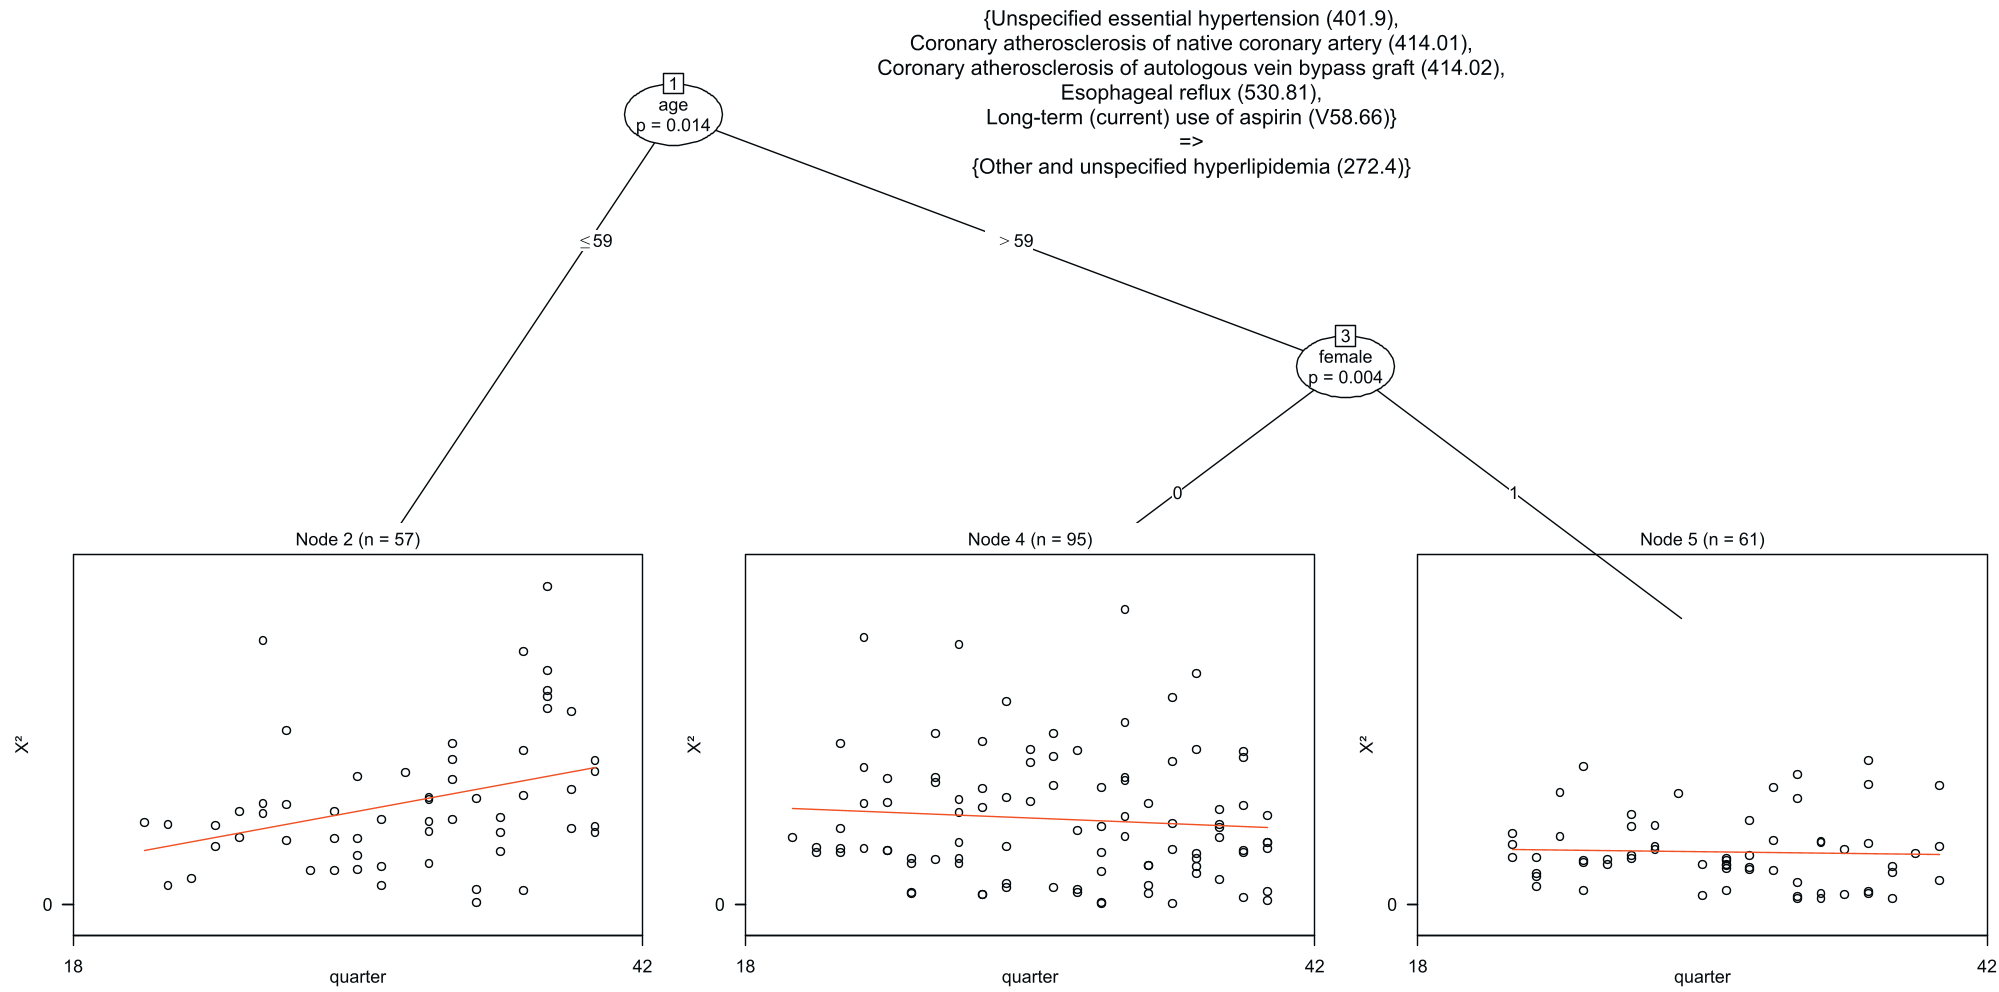
Case Study: Hyperlipidemia (Rule R2)
The algorithm successfully split the group at Age 59.
- Under 59: Showed a positive (upward) trend in rule significance.
- Over 59 (Males): Showed a negative (downward) trend.
Case Study: Hypertension (Rule R5)
For patients with a combination of Diabetes, Hypercholesterolemia, and Coronary Atherosclerosis:
- Ages 50–64: A notable downward trend in support.
- Ages 65+: A consistent upward trend.
This insight is "gold" for insurance companies. An insurer could theoretically reduce premiums for the 50-64 age group because the relative occurrence of this complex diagnosis cluster is decreasing, allowing for more competitive pricing.
Critical Analysis & Conclusion
Takeaway
The power of this method lies in its Visual Interpretability. By placing scatter plots in the leaves of a recursive partitioning tree, clinical researchers can immediately "see" the divergence in patient trajectories. It moves beyond simple correlation to Contrast Mining—finding where groups differ.
Limitations
- Linearity Bias: The current model assumes linear trends within leaves. Real-world medical data can be cyclical or non-linear.
- Support Thresholds: Rules with low support can lead to "flat" trees with a single node, requiring massive datasets (like the NIS) to be truly effective.
Future Outlook
As electronic health records (EHR) become more integrated, this logic could be extended to real-time hospital dashboards. Instead of retrospective 10-year studies, management could see emerging trends in specific wards or demographics month-over-month, enabling proactive resource allocation.
Academic Reference: Hrovat, G., et al. (2014). Contrasting temporal trend discovery for large healthcare databases. Computer Methods and Programs in Biomedicine.