
Sensing the Invisible: Machine Learning Meets SAR for Illegal Transformer Detection
Computers and Electronics in Agriculture
This paper presents a novel remote sensing approach using Sentinel-1 SAR imagery and Machine Learning to detect unregistered Electric Distribution Transformers (EDTs) in agricultural fields. By leveraging the metallic properties of EDTs as corner reflectors, the proposed method utilizes an Extreme Learning Machine (ELM) combined with a specialized feature selection (ELM-FS) to achieve a state-of-the-art mean accuracy of 85.47%.
TL;DR
Unregistered Electric Distribution Transformers (EDTs) are a primary driver of electricity theft in agricultural regions, but their small physical footprint makes them elusive. This research demonstrates that Sentinel-1 SAR images, processed through an Extreme Learning Machine (ELM), can detect these metallic "needles in a haystack" with 85.47% accuracy, even when hidden among vast corn and cotton fields.
Academic Context: This work moves beyond traditional building/ship detection in SAR, shifting focus to micro-infrastructure detection using temporal backscattering signatures and ELM-based feature selection.
Problem & Motivation: The "Bright Spot" in Microwave Data
In regions like Southeast Turkey, illegal electricity usage can reach staggering levels (up to 85%). The culprit is often an unregistered EDT—a 3,800kg metallic block used to power irrigation pumps.
Why not just use Google Earth (Optical)?
- Dielectric Constants: Optical sensors rely on reflectance. Radar (SAR) is sensitive to dielectric properties. Metals have high conductivity and act as corner reflectors, appearing as distinct bright pixels in radar imagery while remaining indistinguishable in optical images.
- Scale: Ground inspections of thousands of hectares are economically unfeasible.
Methodology: Temporal Fingerprinting
The author doesn't just look at one image; they look at the history of the land.
1. Feature Extraction
The study tracks 178 sample points across 32 time-steps (2016–2018). For every point, it captures two polarizations:
- : Vertical-Vertical polarization.
- : Vertical-Horizontal polarization.
This creates a 64-unit feature vector that describes how the "brightness" of a pixel fluctuates over time.
2. The ELM Architecture
The researcher chose the Extreme Learning Machine (ELM) over traditional SVMs or KNNs. ELM is a single-hidden-layer feedforward network where input weights are assigned randomly, and only the output weights are calculated analytically.
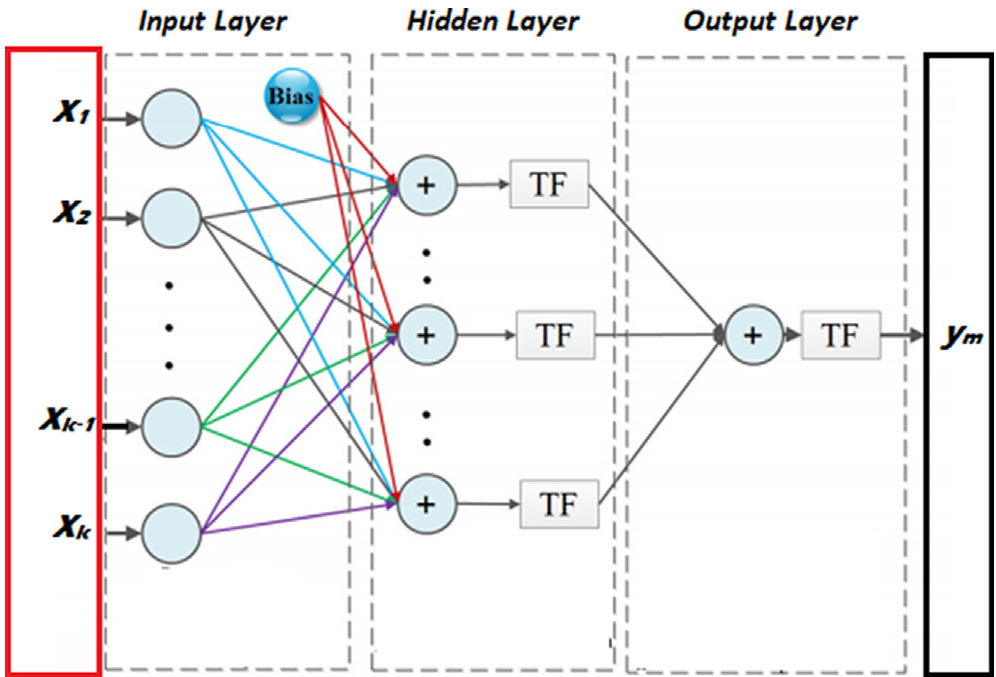 Figure: The ELM architecture used for fast, high-generalization classification.
3. ELM-FS: Feature Selection
Not all months are created equal. In May, irrigation peaks. Using a Statistical Coefficient of Variation (CV), the ELM-FS method ranks features. It discovered that the data from May 2018 was the most "impactful" for detection, likely due to the high contrast between the metallic EDT and the surrounding crops during peak growth.
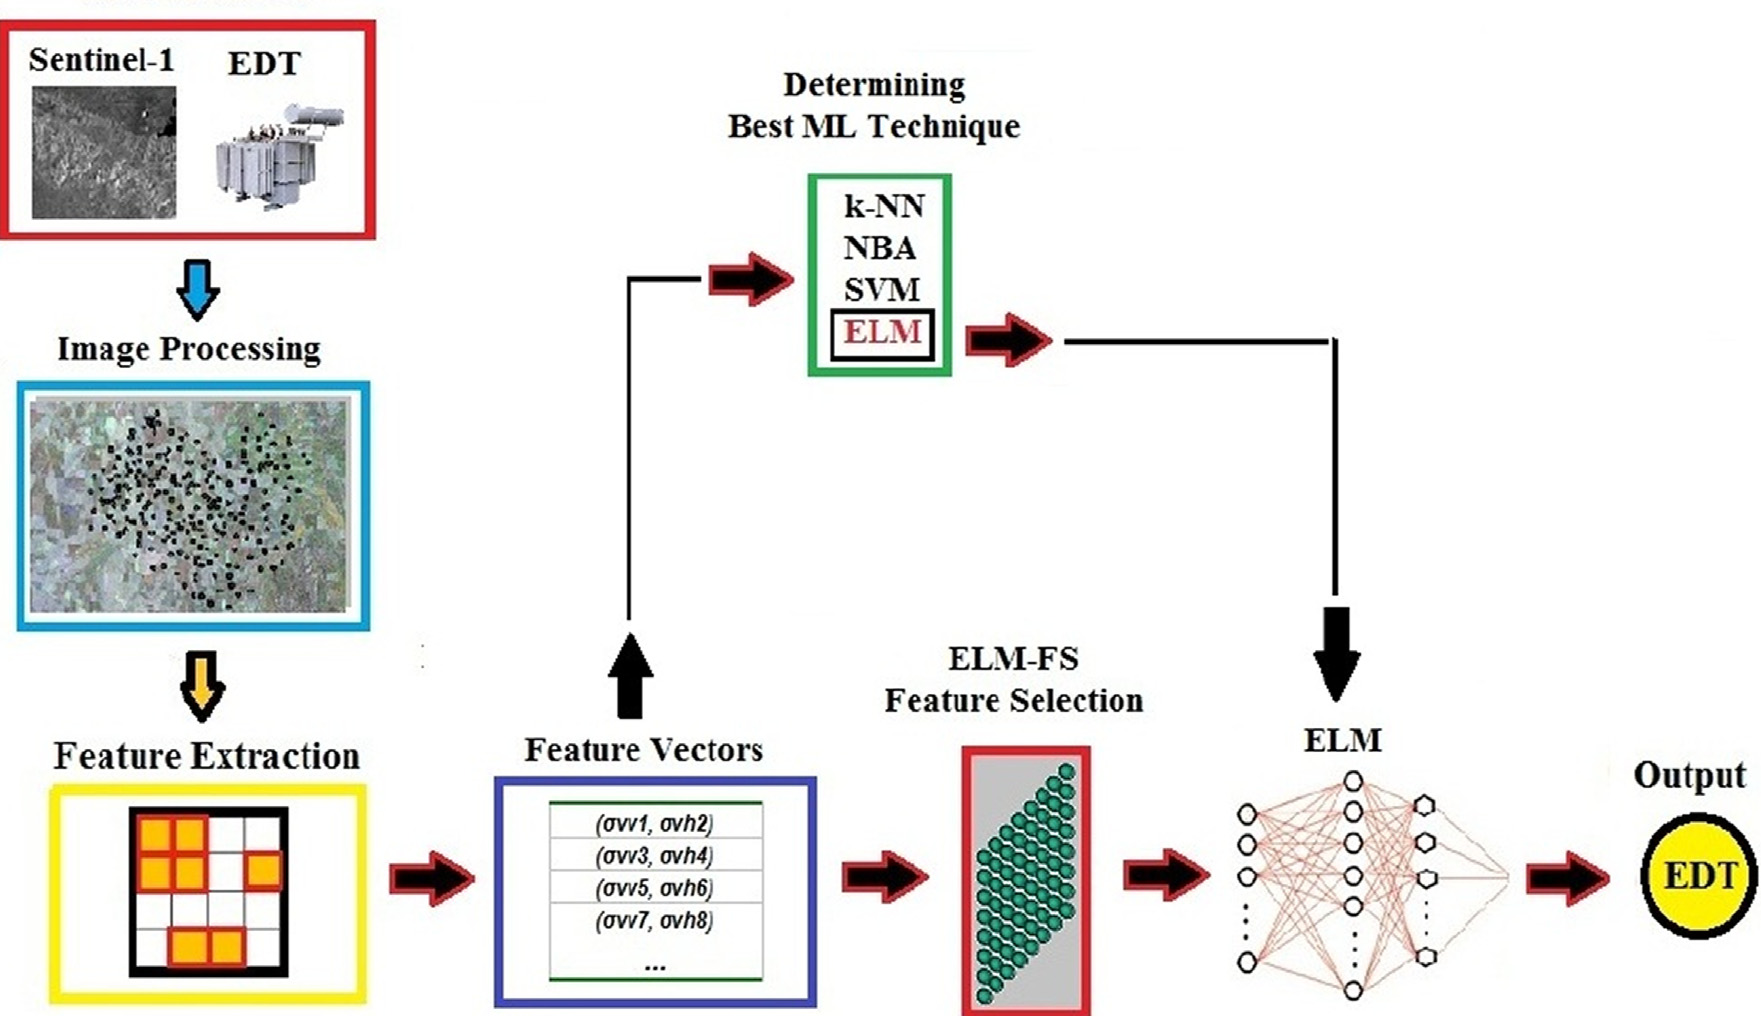 Figure: The proposed workflow from SAR preprocessing to EDT identification.
Experiments & Results: Narrowing the Search
The baseline performance using all features across all techniques showed ELM as the clear winner:
| Technique | Accuracy |
|---|---|
| k-NN | 65.73% |
| SVM | 68.86% |
| NBA | 67.97% |
| ELM | 70.59% |
However, after applying ELM-FS to select the 31 most relevant temporal features, the accuracy jumped to 85.47%.
Key Insight: The performance peak coincides with the agricultural irrigation season (March-May). The presence of the transformer is most "visible" to the radar algorithm when the surrounding environment is changing during the planting season, highlighting the importance of the multi-temporal approach.
Critical Analysis & Conclusion
Takeaway
The paper successfully demonstrates that medium-resolution satellite data (10m pixels) can detect sub-pixel sized objects (1.45m transformers) if those objects are metallic and analyzed via temporal-ML workflows.
Limitations
- Pixel Mixing: At 10m resolution, an EDT occupies only a fraction of a pixel. The "Background Noise" of soil moisture can interfere with the signal.
- Data Density: The reliance on 32 images over two years suggests that real-time detection might be limited by the revisit cycle of the satellite.
Future Outlook
The author proposes using Hybrid Spectral Band Features (combining SAR with Optical data) in future work. This "sensor fusion" approach could likely push accuracy toward 95%, making it a viable commercial tool for utility companies worldwide to protect their grid and reduce illegal consumption.