
Mapping the Pulse of the City: Translating Social Media into 3D Visual Popularity
Computers & Graphics
This paper introduces a novel framework for mapping and visualizing 3D Visual Popularity and sentiment by leveraging geotagged social media data (Twitter, Instagram) integrated into 3D virtual cities. By aligning user-shared photos with reference imagery from Google Street View using a specialized SIFT-based heuristic, the system identifies "popular" landmarks and renders them within a game engine (Unreal Engine 4) using dynamic lighting and color-coded sentiment analysis.
Executive Summary
TL;DR: Researchers have developed a system that harvests geolocated social media posts to "light up" 3D virtual cities. By aligning Instagram/Twitter photos with Google Street View, they can automatically pinpoint and visualize which landmarks are capturing the public’s imagination—and how people feel about them—using dynamic lighting in the Unreal Engine.
Context: This paper sits at the intersection of Computer Vision, GIS (Geographic Information Systems), and Human-Computer Interaction. It moves beyond the "what" of 3D reconstruction (geometry) to the "how much" and "why" of human interest (social saliency).
The Motivation: Why Geometry Isn't Enough
Static 3D models are "dead." A high-fidelity mesh of the Pantheon tells us its shape, but it doesn't tell us where people stand, what angle they prefer for photos, or if there's a festival happening today.
Prior works in Structure from Motion (SfM) like Building Rome in a Day focused on the technical feat of reconstruction from unstructured photo collections. However, social media images are notoriously "noisy" (filled with selfies, food, and bad lighting), making them poor candidates for raw 3D reconstruction but excellent candidates for measuring Social Saliency.
Methodology: The "Social-to-Reference" Pipeline
The core challenge is: How do you accurately place a low-quality Instagram photo into a high-quality 3D map?
1. The Horizontal Coherence Heuristic
Standard SIFT matching fails when social media photos have occlusions (like a tourist's face). The authors solved this with a smart heuristic: assuming photos are mostly upright, they reward feature matches that maintain their relative horizontal order.
- Metric:
score(s, r) = 2|Favorable_Matches| - |Unfavorable_Matches|. This allows the system to filter out "noisy" images that don't actually capture the building architecture.
2. Camera Refinement via Homography
Instead of a full SfM optimization (which is slow and prone to drifting), the authors fix the camera's GPS position (from metadata) and only optimize Rotation and Focal Length. This ensures the "social light" points exactly where the user was looking.
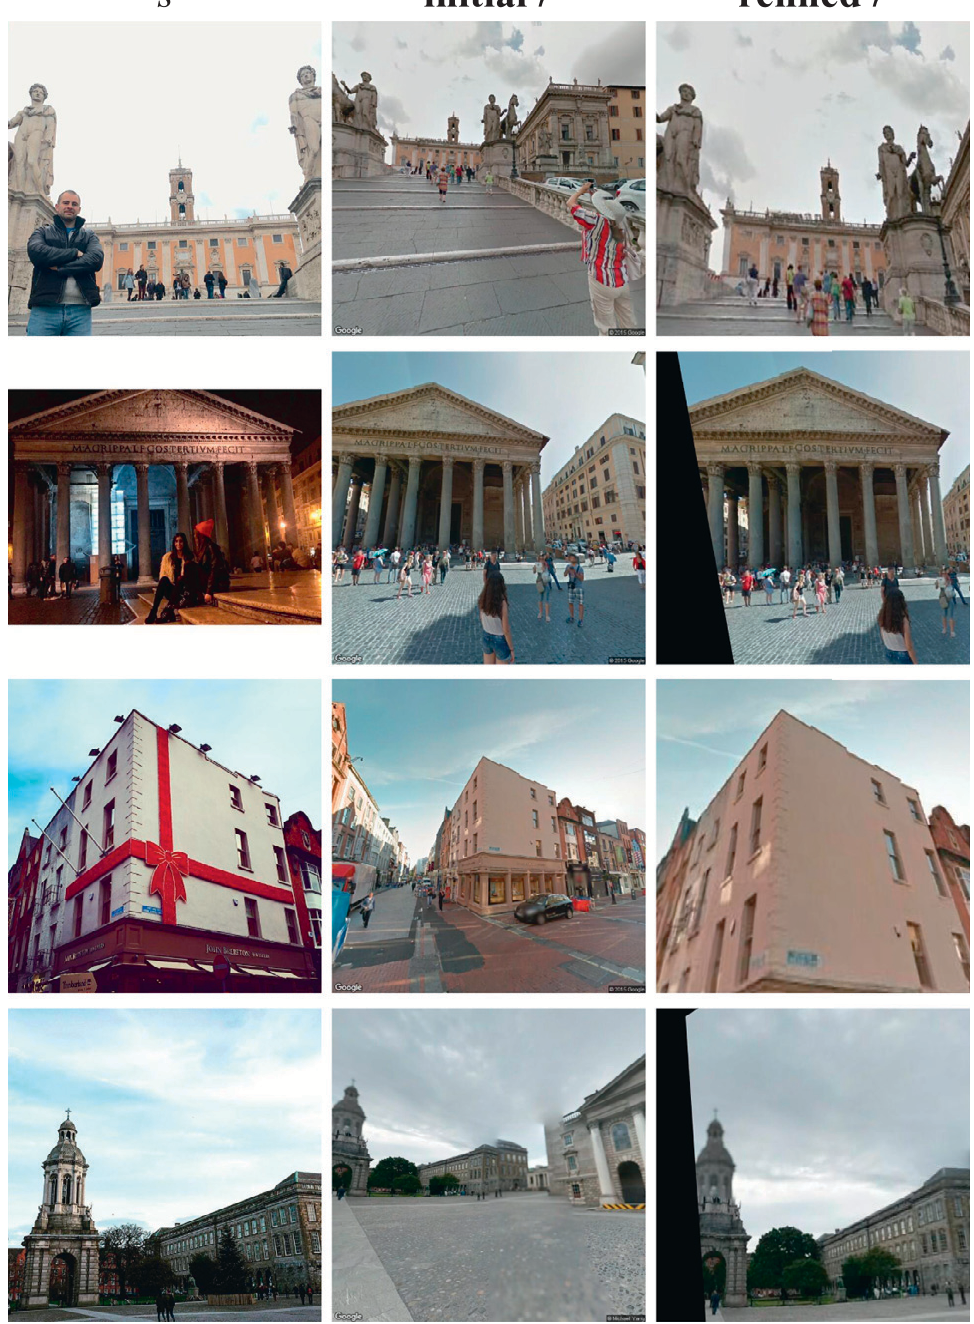 Figure: The alignment process: (Left) Social image, (Middle) Reference Street View, (Right) The refined view showing the visible area.
Experiments: "Lighting Up" Rome and Dublin
The authors applied this to three distinct urban centers:
- Rome: Highly tourist-centric, dominated by historical monuments.
- Dublin: A mix of modern activity and academic landmarks (e.g., Trinity College).
- Pittsburgh: A more homogeneous "skyline" profile.
Visualizing Sentiment and Saliency
The results were visualized in Unreal Engine 4. Each social media post acts as a "Virtual Spotlight."
- Intensity: More photos = brighter light.
- Color: Blue (Negative), White (Neutral), Yellow (Positive), based on NLP sentiment analysis of the captions.
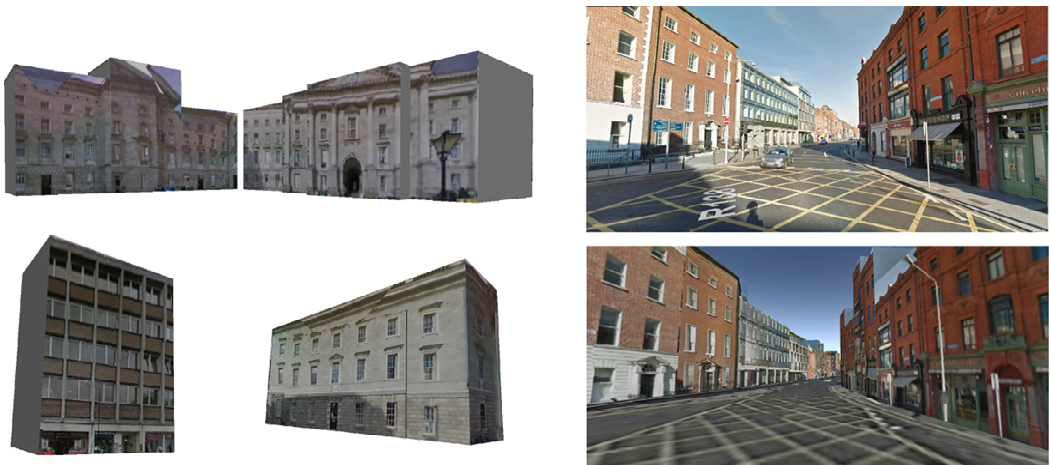 Figure: Per-building popularity maps. Higher popularity (red) correlates with famous landmarks like the Trevi Fountain.
Critical Insight: Beyond the Landmark
One of the most profound takeaways is the system's ability to detect temporal saliency. In Dublin, the system detected a significant "popular" light on a generic wall. Upon investigation, it was a temporary mural painting that had become a viral photo spot. This demonstrates that social-based visualization can capture the dynamic culture of a city that standard maps miss.
Limitations & Future Work
- The "Logo" Problem: SIFT matching can be confused by recurring logos (e.g., McDonalds) across different locations.
- Reflective Surfaces: Glass buildings remain a challenge for feature-based matching.
- The Future: The authors suggest populating these environments with autonomous avatars whose behavior and movement patterns are driven by real-time social media activity, creating a true "Digital Twin."
Conclusion
This research transforms social media from a mere feed of text and images into a volumetric data source. By treating humans as "social sensors," we can better understand how urban spaces are used, loved, or ignored, paving the way for smarter, more responsive urban design.