
Decoding the Plant Electrome: Using Machine Learning to "Listen" to Plant Stress
Computers and Electronics in Agriculture
The paper introduces a novel framework for the automatic classification of plant electrophysiological responses (the "plant electrome") to environmental stressors like cold, low light, and osmotic stress. The core methodology employs Interval Arithmetic for feature extraction combined with supervised classifiers, achieving state-of-the-art results in non-invasive plant stress detection.
TL;DR
Can plants tell us they are stressed before their leaves turn yellow? This paper confirms they can. By analyzing the "plant electrome"—the complex web of low-voltage electrical signals—researchers used Interval Arithmetic and SVMs to identify abiotic stressors (cold, light, and salt) with over 90% accuracy, significantly outperforming traditional Deep Learning on small datasets.
The Motivation: The Hidden Language of Plants
Unlike animals, plants are sessile; they cannot run away from cold or drought. To survive, they have evolved a sophisticated long-distance communication system involving systemic signaling. While biologists have long known that plants generate electrical potentials (like Action Potentials), these signals are often "noisy" and irregular.
The authors recognized a critical gap: traditional statistical methods couldn't distinguish between specific types of stress (e.g., is the plant responding to a cold snap or a lack of light?). They hypothesized that the "noise" itself—the electrome—carried specific patterns that Machine Learning could decode.
Methodology: Math vs. Deep Learning
The researchers tested two distinct philosophies for signal processing:
Approach A: Interval Arithmetic (The Winner)
Instead of feeding raw, high-dimensional time-series data into a model, the authors used Interval Arithmetic (IA).
- The Logic: They divided the signal into windows (bins) and represented each bin as a triplet:
[Minimum, Average, Maximum]. - Dimensionality Reduction: This reduced the feature space from 75,000 raw points down to just 15 highly descriptive features.
- Classifiers: This refined data was fed into Optimum-Path Forest (OPF), k-NN, SVM, and Multilayer Perceptrons.
Approach B: Visual Rhythm & CNNs
The authors converted the 1D electrical signals into 2D gray-scale images (Visual Rhythms) to leverage the power of Convolutional Neural Networks (CNN).
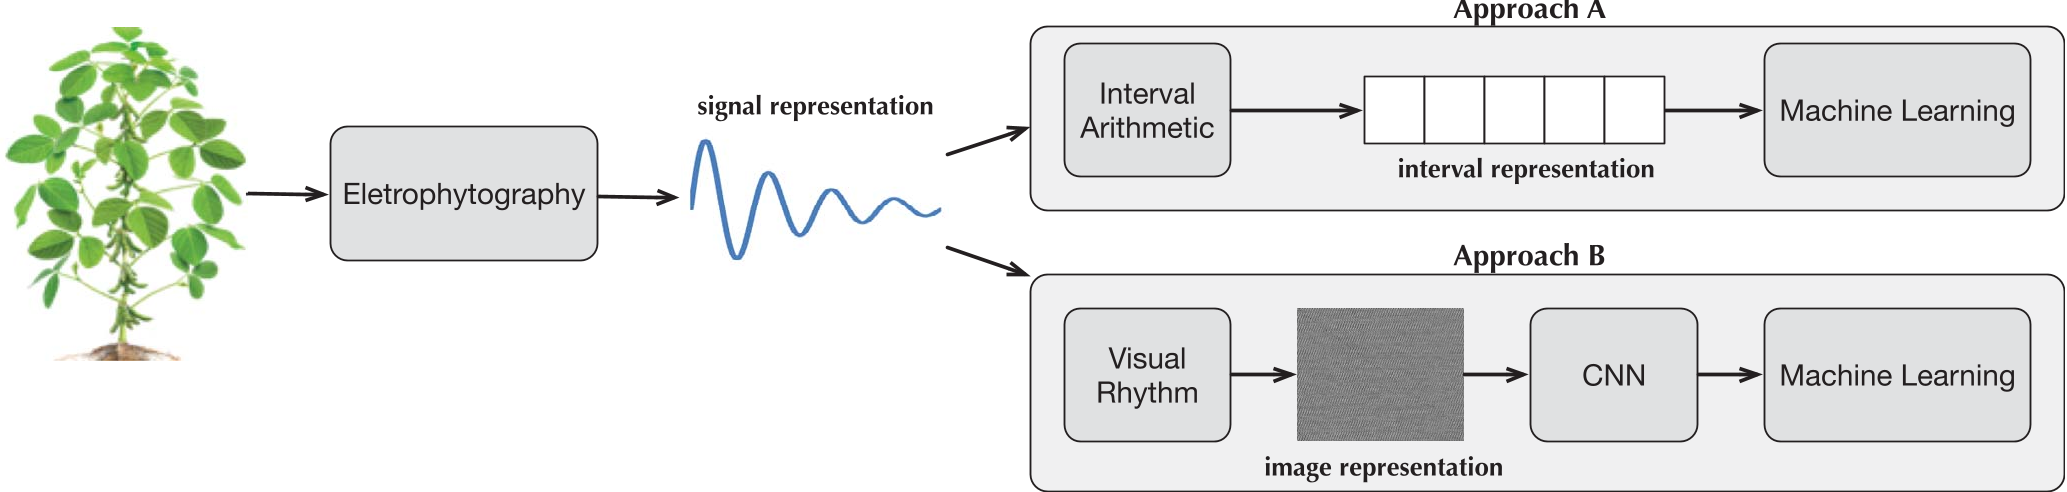 Figure 1: The proposed pipeline showing raw signal acquisition, IA mapping (top), and CNN-based image mapping (bottom).
Key Results: When Less is More
Contrary to the current industry trend toward "Deep Learning for everything," the results showed that SVM (Support Vector Machines) combined with Interval Arithmetic was the superior choice.
| Classifier | Cold Stress Acc (%) | Low Light Acc (%) | Osmotic Acc (%) |
|---|---|---|---|
| SVM (IA) | 90.67 | 80.71 | 80.97 |
| k-NN (IA) | 90.67 | 74.29 | 81.43 |
| CNN | 85.33 | 73.57 | 49.63 |
Deep Insight: The CNN performed poorly on the "Osmotic" and "All" datasets. This is likely because Deep Learning requires massive amounts of data to generalize, whereas biological experiments often yield smaller, high-quality datasets where mathematical feature engineering (like IA) provides a stronger Inductive Bias.
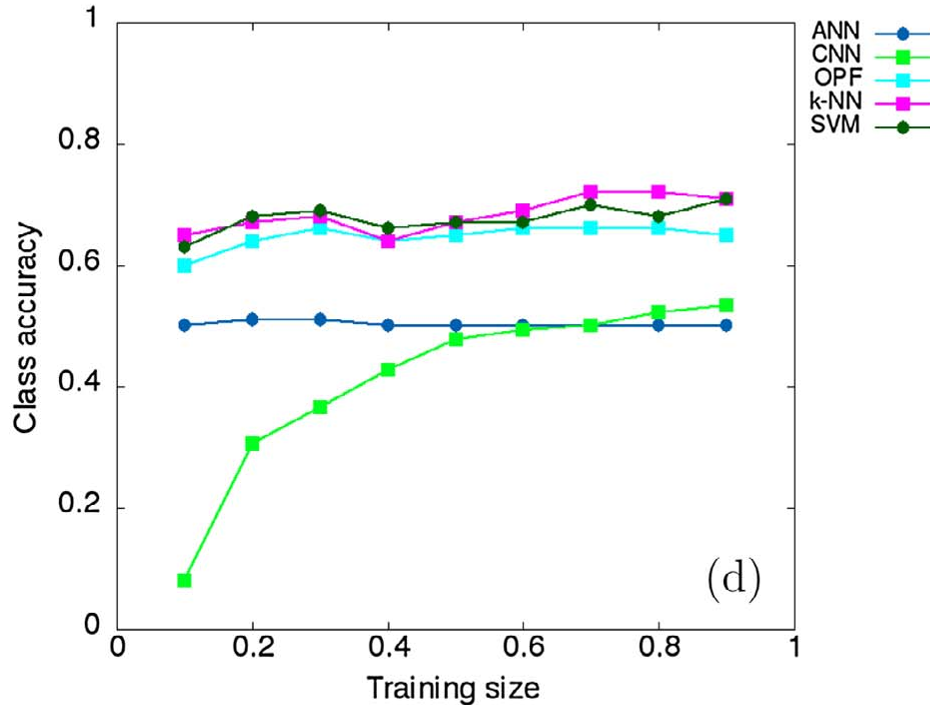 Figure 2: Performance growth relative to training set size. Note the volatility of CNN (blue line) compared to the stability of SVM (red line).
Critical Analysis: Why This Matters
This work is a breakthrough in Precision Agriculture. If we can identify stress-like patterns algorithmically before physical symptoms appear (like leaf necrosis or stunted growth), farmers can intervene earlier, saving crops and optimizing water/fertilizer use.
The Significance of "Intervals"
The success of Interval Arithmetic suggests that for biological signals, the range and bounds of the voltage fluctuations are more informative than the specific waveform shape. The "spikes" and "bursts" mentioned in the discussion are effectively captured by the Min/Max bounds of IA, providing a robust signature of the plant's internal state.
Conclusion & Future Work
The research proves that the plant electrome is not just "noise"—it is a data-rich stream of information. While SVMs currently lead the way, future work could explore hybrid models or Transfer Learning to help Deep Learning architectures cope with the limited data available in bio-electrochemical studies.
Takeaway for AI Researchers: Don't overlook Classical ML and mathematical preprocessing. In domains with limited data and high noise (like biology), a smart mathematical transformation is often worth more than a billion parameters.