
BoFT: Discovering Social Connections in the Age of Private Social Graphs
Connection Discovery Using Big Data of User-Shared Images in Social Media
This paper proposes a connection discovery framework using a "Bag-of-Features Tagging" (BoFT) approach to identify follower/followee relationships in social networks solely through user-shared images. By analyzing over 360,000 images from Skyrock and 163 Weibo, the authors demonstrate that visual similarity in shared content is a strong predictor of social ties, achieving significantly better results than user-annotated tags.
TL;DR
As social media platforms like Instagram and WeChat lock down their social graphs (SGs) for competitive and privacy reasons, third-party developers are left in the dark. This paper presents BoFT (Bag-of-Features Tagging), a system that predicts follower/followee relationships and even user gender purely by analyzing the visual features of shared images. It proves that what you post is a remarkably accurate mirror of who you know.
Background: The Death of the Open Social Graph
Historically, social discovery relied on the "friends of friends" (FoF) logic or "User Tags" (textual labels). However, SGs are now proprietary silos, and tags are notoriously unreliable—users are often too lazy to tag, or they use inconsistent languages. The authors of this paper ask: Can we use the pixels themselves to rebuild the bridge between users?
Methodology: From Pixels to Social Profiles
The core of the "Bag-of-Features Tagging" (BoFT) approach is to treat a user's collection of images like a document comprised of visual "words."
1. The Computer Vision Pipeline
The system follows a classic computer vision workflow to eliminate human bias:
- Feature Extraction: Using SIFT (Scale-Invariant Feature Transform) to find points of interest that remain consistent regardless of lighting or angle.
- Codebook Generation: Clustering millions of features into a "Visual Vocabulary."
- BoFT Labeling: Every image is assigned a label based on which visual "cluster" its features fall into.
2. Formulating Connection Probability
The researchers observed that the distribution of visual similarity among users follows a strict Power Law. By applying Bayes' Theorem, they formulated a way to calculate the exact probability that two users are connected based on the overlap of their visual profiles.
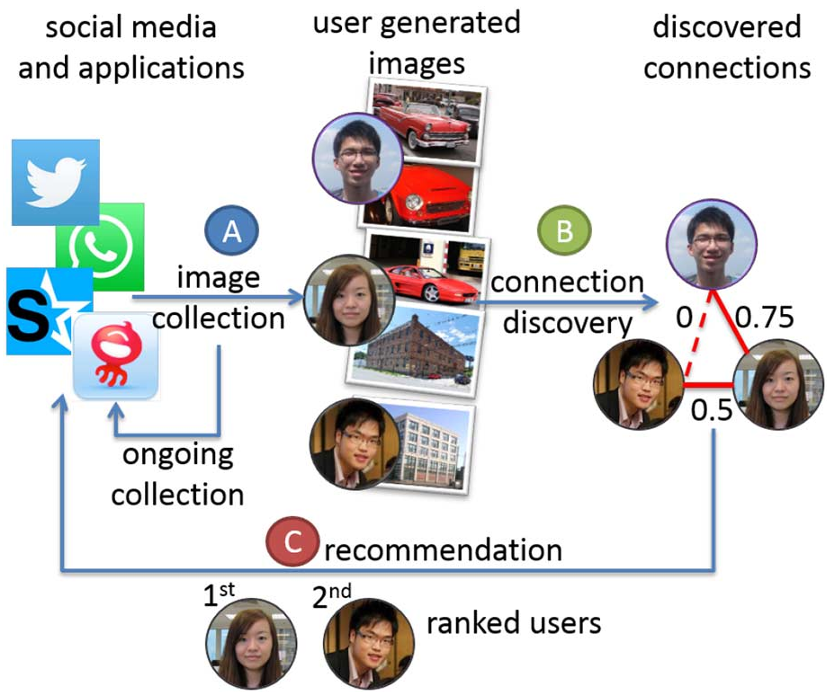 Figure: The system workflow—collecting images, discovering connections via BoFT, and generating recommendations.
Experiments: Validating the "Visual Mirror"
The study was massive, involving 360,000 images and 3 million relationships from two culturally distinct networks: Skyrock (Europe) and 163 Weibo (China).
SOTA Comparisons
The authors compared BoFT against three baselines:
- FoF (Friends of Friends): The "Upper Bound" (requires social graph access).
- UserT (User Semantic Tags): The "Manual Baseline" (requires text tags).
- Rand (Random Selection): The "Lower Bound."
Results showed:
- BoFT was 60% better than using user tags on Flickr.
- In gender prediction, BoFT achieved 70%+ accuracy, proving that "Visual Interests" are highly gendered and socially clustered.
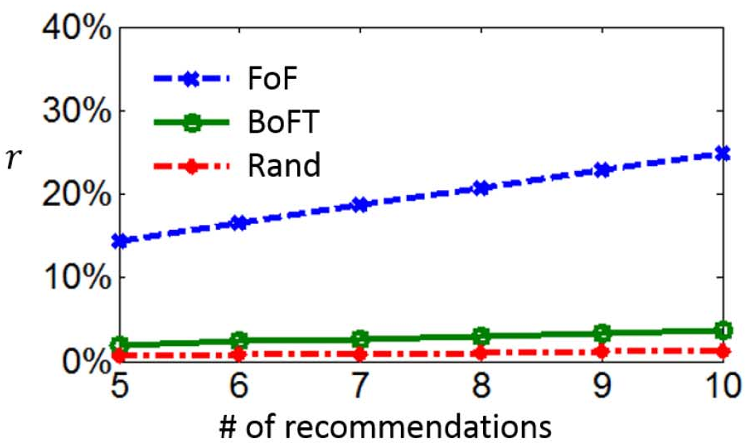 Figure: Performance metrics showing BoFT significantly outperforming random and tag-based methods.
Critical Insight: Why Does This Work?
The effectiveness of BoFT stems from Homophily—the sociological principle that "birds of a feather flock together." If two people follow each other, they likely share sub-cultures (e.g., drifting cars, vintage aesthetics, or gourmet cooking). These shared interests manifest as visually similar clusters in the Bag-of-Features space, even if the users speak different languages or don't use tags at all.
Challenges & Limitations
While powerful, the method has its hurdles:
- Computational Cost: SIFT and K-means clustering on a "Big Data" scale require significant cloud resources (verified by the authors using Amazon EC2).
- Low-Level vs. High-Level: BoFT uses low-level features. Two images of "sunsets" and "golden retrievers" might share similar color distributions but have different semantic meanings. The authors suggest future work involving Deep Learning to capture higher-level semantics.
Conclusion
This paper is a landmark for third-party researchers. It proves that in a world of "walled garden" social networks, the visual content users share is a publicly accessible "shadow graph" that can be used to reconstruct social connections with surprising accuracy.
Takeaway
If you are building a recommendation engine and can't access the Facebook/Instagram social graph, look at the pixels. They speak louder than tags.