
Decoding Heart Chaos: How Nonlinear Dynamics Detect Aortic Disorders in Children
Correlation Dimension Analysis of Doppler Signals in Children with Aortic Valve Disorders
This study utilizes Correlation Dimension (D2) analysis to quantify the complexity of aortic valve Doppler signals in children. By applying the Grassberger–Procaccia algorithm to signals from healthy, aortic stenosis (AS), and aortic insufficiency (AI) subjects, the researchers successfully differentiated pathological states from healthy ones based on nonlinear chaotic dynamics.
TL;DR
Researchers have moved beyond simple frequency analysis to embrace the "chaos" of the human heart. By calculating the Correlation Dimension (D2) of Doppler signals, this study reveals that heart diseases like Aortic Stenosis and Insufficiency significantly increase the complexity—or "chaoticity"—of blood flow, providing a new non-invasive metric for pediatric diagnosis.
Background: Beyond the Linear Beat
In pediatric cardiology, early detection of Aortic Stenosis (AS) and Aortic Insufficiency (AI) is a matter of life and death. Traditionally, doctors rely on Spectral Analysis (FFT) to view Doppler shifts. However, blood flow isn't just a set of frequencies; it is a complex, non-stationary dynamical system. When a valve fails to open or close correctly, it creates turbulence—a physical state that is inherently chaotic. This paper argues that instead of looking at the noise, we should measure the structure of that chaos.
The Core Insight: The Correlation Dimension
The Correlation Dimension (D2) describes the minimum number of independent variables required to describe a system's dynamics. A higher D2 indicates a more complex, less predictable system. In this study, the authors hypothesize that the turbulence caused by valvular disorders adds "dimensions" to the blood flow dynamics, making the Doppler signal more complex than that of a healthy heart.
Methodology: Reconstructing the Heart's Attractor
To calculate D2, the researchers didn't just look at the raw 1D wave. They used Phase Space Reconstruction:
- Wavelet Denoising: Using
Db8wavelets to strip away high-frequency noise that could falsely increase the dimension. - Takens' Embedding: Turning the 1D signal into a multi-dimensional "map" (attractor).
- Optimization: Using the Average Mutual Information (AMI) to find the perfect time delay (), ensuring the coordinates of the phase space are independent but related.
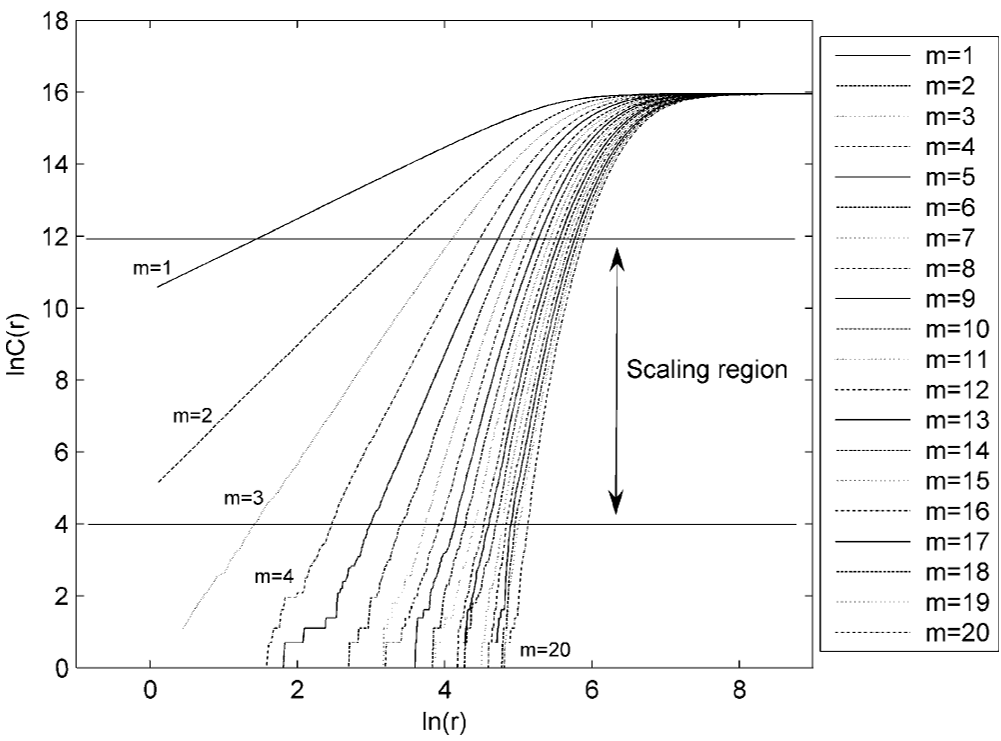 Above: The correlation integrals. As the distance 'r' decreases, the slope of these lines (D2) reveals the fractal dimension of the heart's blood flow.
Experimental Results: The Signature of Disease
The study involved 40 children (20 healthy, 10 AS, 10 AI). The findings were striking:
- Healthy Group: Lower complexity (Mean D2 ≈ 7.49).
- AI Group: Increased complexity (Mean D2 ≈ 9.49).
- AS Group: Highest complexity (Mean D2 ≈ 11.42).
The significant jump in D2 for AS patients suggests that an obstructed valve forces the cardiovascular system into a much more unstable, high-dimensional chaotic state.
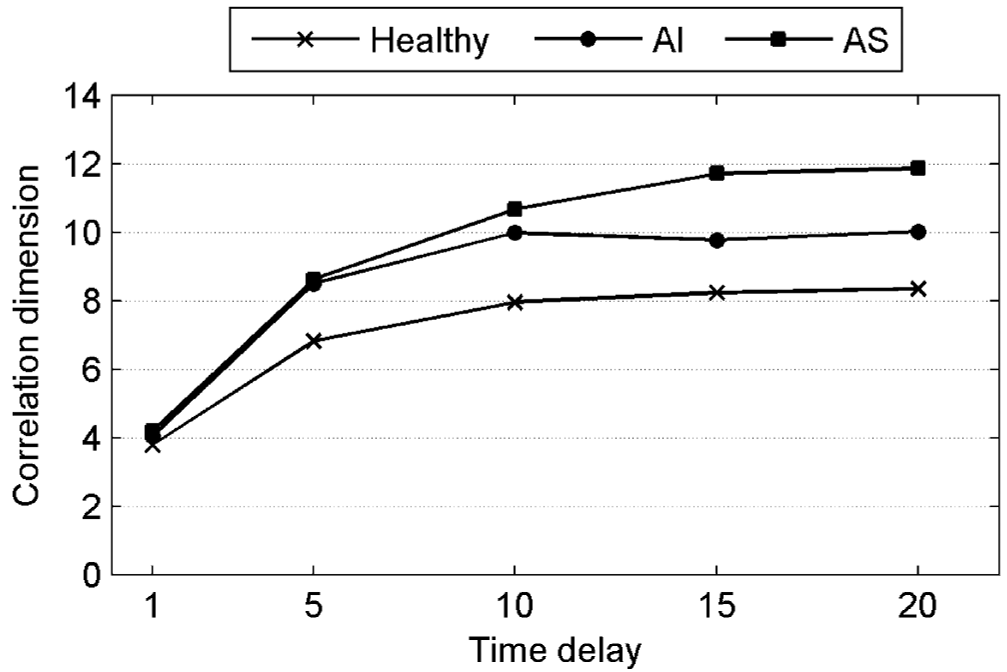 Above: The variation of mean D2 values across groups. Note how the separation between healthy and pathological cases remains consistent across different time delays, with FMAMI providing the cleanest separation.
Clinical Implications & Analysis
The beauty of this approach is its Biophysical Intuition. In a healthy heart, blood flow is relatively laminar and "ordered." In AS and AI, the physical obstruction or backflow creates vortices and eddies (turbulence). Mathematically, this shifts the system from a low-order attractor to a high-order one.
Key Takeaways:
- Chaos is Metadata: The "noise" in a Doppler signal contains geometric information about the valve's health.
- Time Delay Matters: The study proves that D2 is sensitive to ; using AMI to pick is not just an academic exercise but a clinical necessity for accuracy.
- Non-Invasive Potential: This could be integrated into existing echocardiography software to provide an automated "Complexity Score" for cardiologists.
Limitations and Future Work
While the results are statistically significant (P < 0.05), the sample size is relatively small (40 subjects). Furthermore, D2 calculation is computationally intensive compared to FFT. Future research should look into permutation entropy or approximate entropy as faster alternatives that might offer similar diagnostic power in real-time clinical settings.
Conclusion
By treating the heart as a nonlinear dynamical system rather than a simple pump, this research opens the door to a more nuanced understanding of valvular diseases. The Correlation Dimension isn't just a number—it’s the fingerprint of the heart's internal turbulence.