
Decoding Corruption: A Machine Learning Approach to Socio-Economic Drivers
The Corruption Perception Index: analysis of dependence on socio-economic indicators
This paper presents a data-driven framework to analyze the dependence of the Corruption Perception Index (CPI) on various socio-economic indicators. Using cluster analysis (K-means) and Bagging ensemble learning with decision trees, the authors successfully identified key predictors of corruption and classified countries into risk levels.
TL;DR
Researchers from NRNU "MEPhI" have developed a robust machine learning framework that moves beyond simply measuring how much corruption exists to understanding why it persists. By analyzing 180 countries across 69 indicators, they identified that bureaucratic hurdles—specifically time and cost in business registration and imports—are among the most significant predictors of the Corruption Perception Index (CPI). Their Bagging-based classification model can predict a country's corruption risk with 89% accuracy.
Background: The Subjectivity Gap
The Corruption Perception Index, published by Transparency International, is the gold standard for comparing global corruption. However, it is fundamentally a "survey of surveys"—a collection of opinions rather than hard economic data. The motivation for this research was to bridge the gap between subjective perception and objective socio-economic reality. Can we predict perception through data like "life expectancy" or "time spent paying taxes"?
Methodology: The Analytical Pipeline
The authors proposed a multi-stage data analysis scheme:
- Data Harmony: Collection from IMF, UN, and World Bank sources across 180 countries.
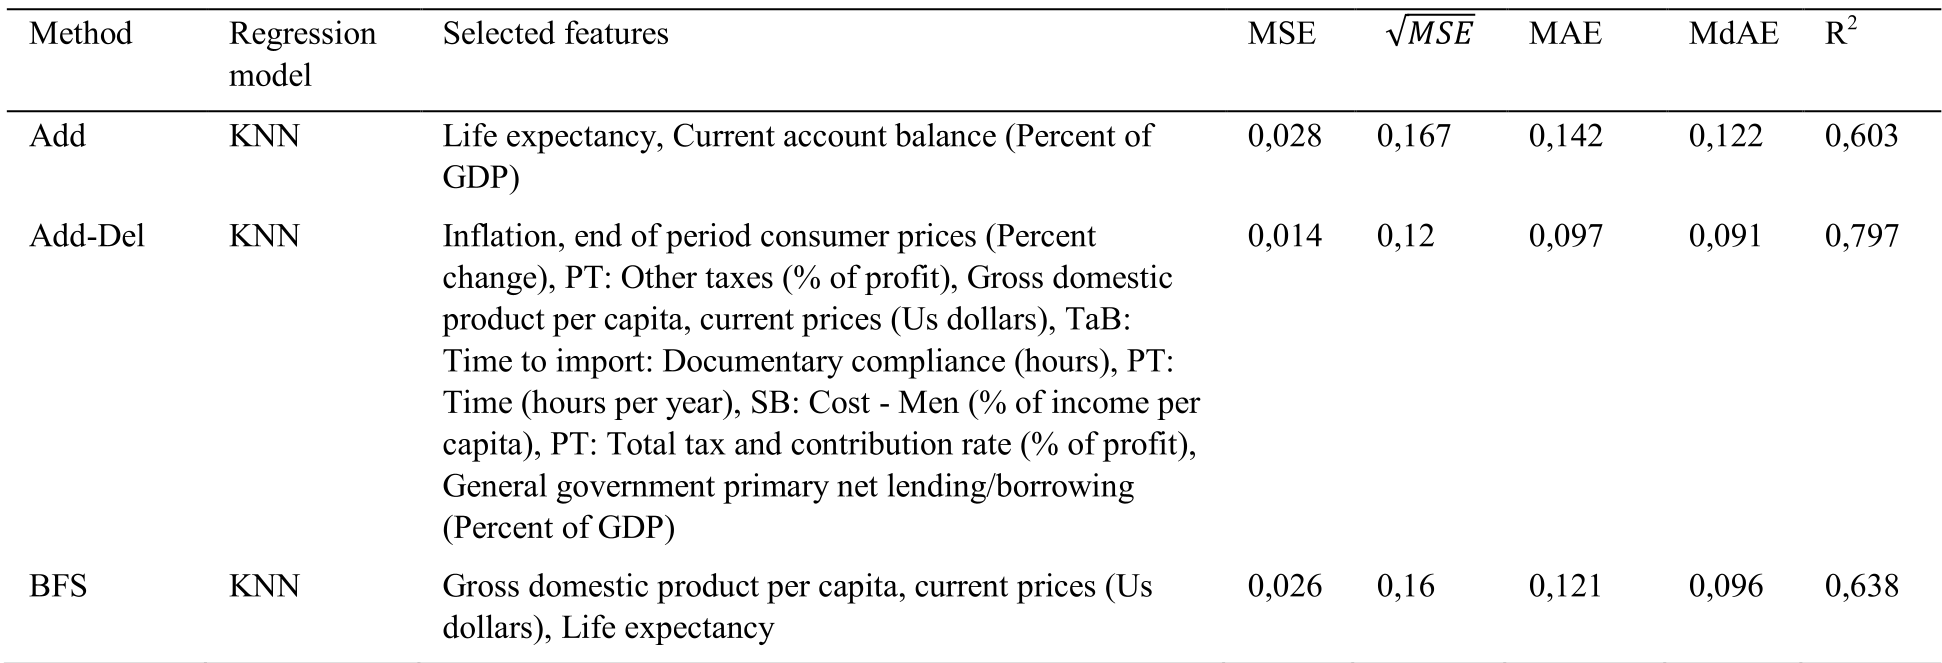
- Feature selection: Reducing noise from 69 initial attributes to 12 "High-Impact" features using Breadth-First Search (BFS) and Add-Del methods.
- Clustering (K-Means): Dividing the world into three distinct archetypes of corruption/development.
- Classification (Bagging): Training an ensemble model to identify which cluster a country belongs to based on its metrics.
The Core Architecture
The feature selection process was critical. They found that a mix of Economics (Unemployment, Inflation), Standard of Living (Life Expectancy), and Business Management (Time to import, cost of starting a business) provided the best predictive power.
Key Insights from Clustering
The K-means algorithm revealed a clear tri-modal distribution of global corruption:
- Cluster 0 (CPI Avg 51.5): Developed nations (USA, Europe, Japan). Characterized by high life expectancy and low bureaucratic "friction."
- Cluster 1 (CPI Avg 19.4): Low levels of development (Sub-Saharan Africa, parts of Asia). Characterized by high costs of starting a business and long import times.
- Cluster 2 (CPI Avg 41.1): Transitional economies (Russia, Brazil, Argentina). This group suffered specifically from high property registration times.
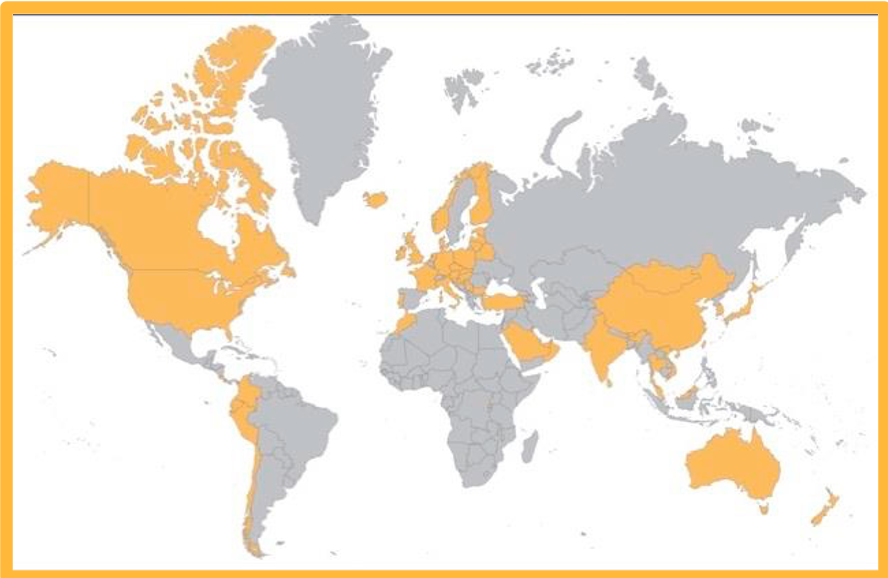 Fig 1: Geographical distribution of countries in Cluster 0 (Lower Corruption).
Experimental Results: The Power of Ensembles
To move from observation to prediction, the authors tested four ensemble algorithms. While Random Forest and Gradient Boosting performed well, Bagging (with Decision Trees as base classifiers) emerged as the winner.
| Class | Precision | Recall | F-score |
|---|---|---|---|
| High CPI (Low Corruption) | 0.96 | 0.91 | 0.94 |
| Low CPI (High Corruption) | 0.76 | 0.93 | 0.84 |
| Medium CPI | 0.85 | 0.79 | 0.81 |
The model demonstrates that socioeconomic data can indeed reverse-engineer the expert opinions found in the CPI.
Critical Analysis & Takeaways
The most striking takeaway from this study is the confirmation of the "Incentive-Based" theory of corruption. The data shows that corruption isn't just a cultural trait; it is a response to structural inefficiency. When "Time for paperwork for import" or "Cost of starting a business" is high, the "Shadow Economy" becomes a rational choice for entrepreneurs, creating a breeding ground for bribery.
Limitations
- Causality vs. Correlation: The study proves dependence but doesn't strictly prove that reducing "import time" causes a drop in corruption (though it is strongly implied).
- Expert Bias: Since the model is trained to predict the CPI (which is based on surveys), it may also be learning the inherent biases of the experts who were surveyed.
Future Outlook
This work provides a roadmap for governments. Instead of vague anti-corruption "campaigns," the data suggests that digitalizing the tax process and slashing bureaucratic delays in property registration are the most effective technical interventions to improve a nation's standing and reduce corruption risk.