
CovidStream: Mapping the Emotional Pulse of a Pandemic through Deep Learning and Visual Analytics
CovidStream: Interactive Visualization of Emotions Evolution Associated with Covid-19
The paper introduces CovidStream, an interactive visual analytics tool designed to monitor the temporal evolution of emotions (anger, fear, joy, and sadness) associated with COVID-19 in Peru. It integrates an LSTM-based recurrent neural network for Spanish sentiment classification with hybrid visualization techniques like StreamGraph and WordCloud.
TL;DR
CovidStream is an innovative interactive tool that tracks how Peruvian citizens felt during the COVID-19 crisis. By combining LSTM-based deep learning for Spanish sentiment analysis with dynamic StreamGraphs, it doesn't just show that people were afraid—it shows who and where triggered those emotions in real-time.
Context & Motivation: Moving Beyond Accuracy
In the world of NLP, researchers often obsess over increasing classification accuracy by 1%. However, the authors of "CovidStream" argue that for policy-makers, a label of "Fear" is useless without context. If a population is afraid, is it because of a specific government announcement, a shortage in a particular city, or global news?
Prior works often neglected the Spanish language and failed to link emotions to the entities (Named Entity Recognition) that cause them. This paper fills that gap by localizing the study to Peru, one of the hardest-hit nations during the 2020 pandemic.
Methodology: The Technical Backbone
The system follows a sophisticated pipeline consisting of data acquisition, deep learning classification, and visual mapping.
1. The Emotion Engine (LSTM)
The researchers utilized a Long Short-Term Memory (LSTM) network. LSTMs are particularly effective for text because they can capture long-term dependencies in sequences, which is crucial for understanding the nuance of human emotion in short tweets.
- Training Data: SemEval-2018 Task 1 (Spanish subset).
- Architecture: Embedding layer (dim=500) -> LSTM (512 units) -> Dense -> Dropout -> Softmax.
- Performance: 74.64% accuracy, a competitive result for multi-class Spanish emotion detection.
2. The Visualization Architecture
The tool adapts the WordStream concept, which combines the aesthetic appeal of a WordCloud with the temporal logic of a StreamGraph.
 Figure 1: The proposed pipeline, from tweet extraction via GetOldTweets3 to the final visual interface.
The interface is split into four distinct layers (L1-L4):
- L1-L3 (Entities): Visualizing the frequency of people (e.g., President Vizcarra), places (e.g., Wuhan, Lima), and organizations (e.g., WHO/OMS).
- L4 (Emotions): Visualizing the intensity of Anger, Fear, Joy, and Sadness.
Insights from the Data
The experimental results derived from Peruvian tweets between January and July 2020 provide a fascinating look at a nation in crisis:
- The Dominance of Fear: Unlike many general sentiment studies, "Fear" was overwhelmingly the primary emotion.
- Causal Links: By using the tool's interaction features, the authors proved that in January, Fear was linked to "China" and "Wuhan." By March, the focus shifted to domestic leadership and regional neighbors like Brazil.
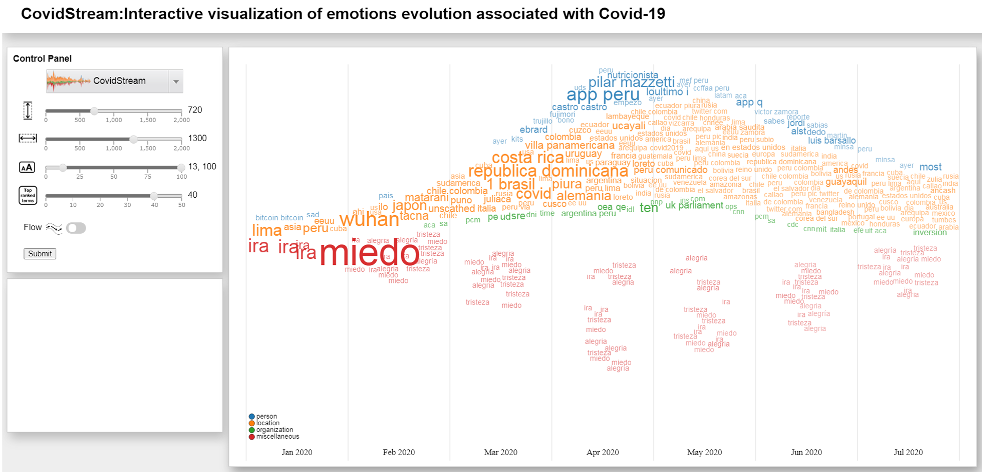 Figure 2: The evolution of emotions over time. Note the sustained high volume of 'Miedo' (Fear) compared to 'Alegría' (Joy).
Critical Analysis & Takeaways
Strengths
- Contextual Intelligence: It moves NLP from "prediction" to "description and explanation."
- Localized Value: Directly addresses the needs of Spanish-speaking governance.
Limitations
- Architecture Evolution: While LSTM was strong in 2020, modern Transformers (BERT/BPM) would likely offer higher accuracy and better nuance in entity relationship extraction.
- Geographic Bias: The study is heavily focused on Lima (capturing tweets within a 50km radius), potentially missing provincial perspectives.
Future Outlook
CovidStream sets a precedent for "Sentiment Surveillance" tools. Future iterations could integrate Zero-shot Cross-lingual models to handle the slang and dialects unique to different Latin American regions, providing even more granular feedback for public health officials.