
Crime on the Move: Predicting Urban Risk via Human Mobility Networks
Crime Rate Prediction with Region Risk and Movement Patterns
This paper introduces a novel framework for crime rate prediction that leverages human mobility patterns from Foursquare data. The authors propose the DIrected graph Flow FEatuRes (DIFFER) method, which utilizes a directed graph to capture movement dynamics between urban regions to estimate location-specific crime risks.
TL;DR
Researchers have developed a new method called DIFFER (DIrected graph Flow FEatuRes) that predicts crime rates by analyzing how people move between neighborhoods. By treating a city as a directed graph of Foursquare check-ins, the study proves that "inflowing risk"—movements coming from high-crime areas—is a significant predictor of crime at the destination, regardless of the individuals' intent.
Problem & Motivation: The Static Lens Gap
Most urban crime models treat city blocks as islands. They look at who lives there (demographics) or what is there (POIs like bars or banks), but they often ignore who is passing through.
The authors argue that urban risk is liquid. A region might be safe at 8:00 AM but high-risk at 6:00 PM simply because of the shift in population flow. Existing work using taxi data or static check-in counts failed to capture the temporal directionality of these movements—the fact that morning commutes and evening returns create entirely different risk profiles for the same two nodes.
Methodology: Mapping the Flow of Risk
The core innovation lies in the Region Risk Factor (RR) and the subsequent DIFFER features.
1. The Directed Mobility Graph
The city is divided into a 400x400 grid. Every Foursquare check-in from Grid A to Grid B creates a directed edge. The weight represents the volume of people moving.
2. Formulating Risk
The Region Risk Factor is calculated as: Where is crime count and is check-in volume. This identifies regions that are "disproportionally" dangerous relative to their activity level.
3. The DIFFER Feature Set
The authors derive features based on the ancestor nodes:
- Risk Distribution: The average risk level of all regions where people are coming from.
- Risk Count: The number of "high-risk" origin regions connected to the focal node.
- Risk Ratio: The proportion of incoming movement originating from high-risk areas.
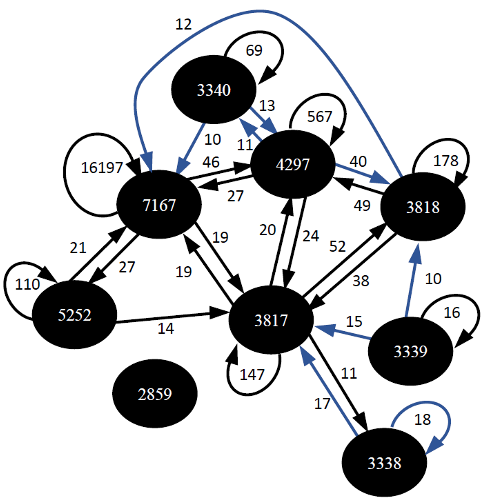 Figure 1: Comparison of movement patterns in NYC between morning (a) and afternoon, showing the necessity of temporal-directed analysis.
Experiments & Results
The researchers tested their features in Chicago and New York City using three regression models: Linear Regression, Random Forest (RF), and XGBoost.
Key Findings:
- Superior Accuracy: Models using DIFFER features consistently showed lower Mean Absolute Error (MAE) compared to those without.
- Algorithm Effectiveness: Ensemble tree-based models (RF and XGBoost) outperformed Linear Regression, suggesting the relationship between mobility and crime is non-linear and complex.
- Statistical Significance: The p-values for DIFFER features were significantly low (often < 0.001), indicating they are not just "noise" but fundamental drivers of the prediction.
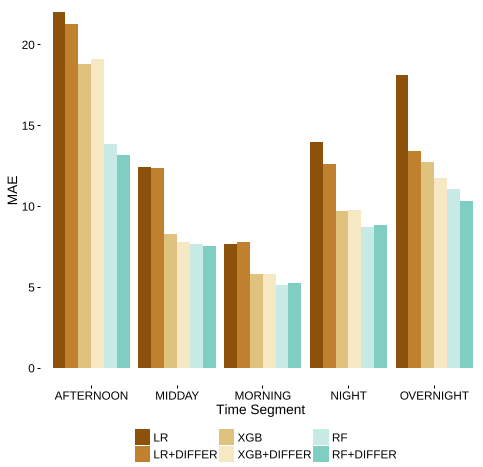 Figure 2: Performance comparison in NYC—the blue bars (with DIFFER) represent lower error across various time segments.
Critical Analysis & Conclusion
Takeaway
The paper successfully shifts the focus from "where the crime happens" to "how the risk moves." The DIFFER framework provides a scalable way to integrate social network data into traditional law enforcement analytics.
Limitations
- Data Bias: Foursquare users are not a perfect proxy for the general population. They tend to be younger and more tech-savvy, which might bias the "movement" data toward certain urban activities.
- Sparsity: The model requires a minimum of 10 unique movements to be effective, which might limit its use in rural or less-connected suburban areas.
Future Outlook
This approach opens the door for Real-time Predictive Patrolling. If authorities can monitor mobility flows via cellular data or transit hops, they could theoretically predict "crime surges" hours before they occur, moving from reactive to proactive urban management.