
How Big is the Crowd? Decoding Population Dynamics from Social Footprints
How Big is the Crowd? Event and Location Based Population Modeling in Social Media
The paper introduces a time-evolving population model to estimate the size, duration, and temporal dynamics of short-lived crowds (event-driven and location-driven) using social media footprints. It utilizes a framework consisting of immigration, emigration (duration-based), and emission models to track crowd populations and their digital artifacts like tweets.
TL;DR
Quantifying the size and lifespan of human gatherings is vital for urban planning and disaster response, yet social media often only tells us when a person arrives, not when they leave. This paper proposes a robust time-evolving population model that uses "post gaps" to derive stay durations, allowing researchers to accurately predict both the remaining crowd size and the volume of future posts with high precision (reducing error by up to 77%).
Background: The "Check-In" Blind Spot
When you tweet from a coffee shop or a protest, you provide a "birth" record for a digital crowd. However, few people tweet "I am now leaving the protest." This lack of "check-out" data makes standard population modeling — rooted in the balance of immigration and emigration — nearly impossible with raw social media feeds.
The authors of this study identify three primary hurdles:
- Incompleteness: Missing departure timestamps.
- Sparsity: Only a fraction of the crowd actually posts.
- Burstiness: Crowds form and dissolve faster than traditional sensors can track.
Methodology: From Duration to Dynamics
The core innovation lies in the Duration Model. By analyzing the time intervals between a user's post at Location A and their subsequent post elsewhere, the authors discovered that crowd duration follows a Power Decay Law.
1. The Population Model
The population at any time is traditionally . Since (emigrants/check-outs) is unknown, the authors model it as a convolution of previous check-ins and the probability of staying for a specific duration .
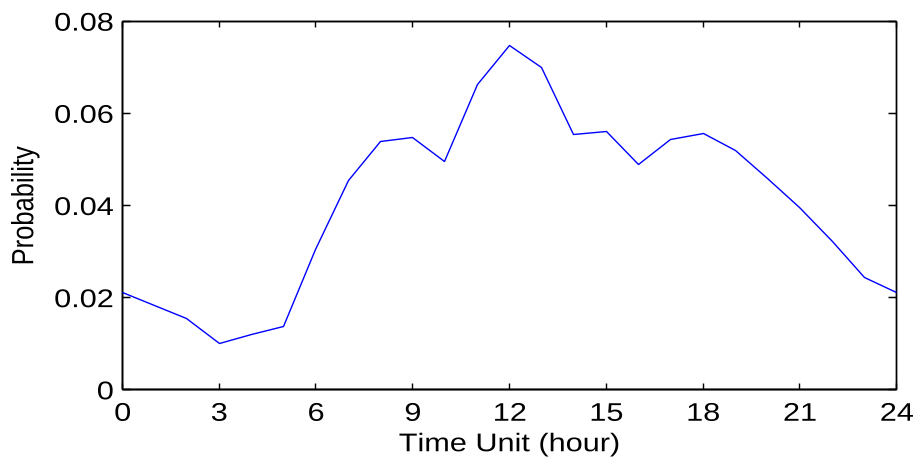 Figure 1: Typical check-in patterns showing temporal peaks (e.g., McDonald's lunch rush).
2. The Emission Model
Going beyond mere headcounts, the "Emission Model" estimates the artifacts a crowd produces. By testing Uniform, Exponential, and U-shaped distributions, they found that participants in long-term events tend to distribute their posts uniformly throughout their stay, rather than just at the start.
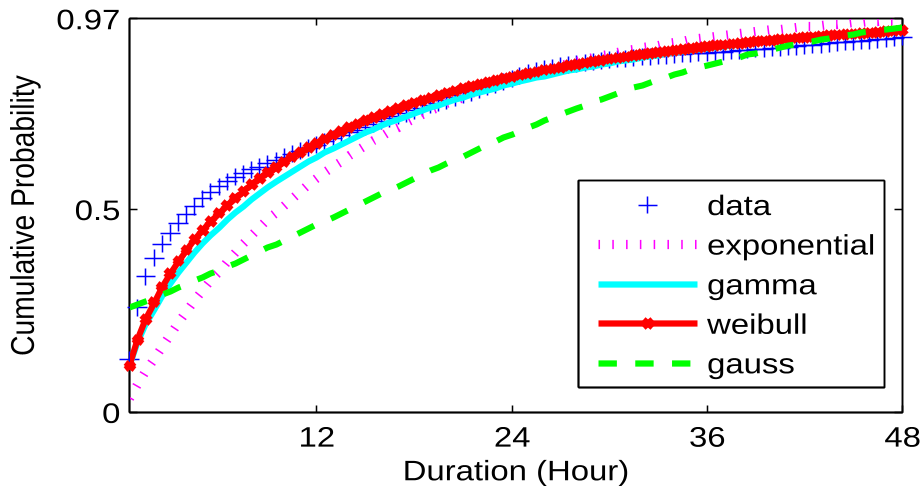 Figure 2: Fitting cumulative duration probabilities using Weibull and Gamma distributions.
Experiments: Manhattan Traffic and Global Events
To validate the model, the researchers applied it to two diverse scenarios:
- Urban Traffic: Using traffic volume on Manhattan's 19 bridges/tunnels. By treating bridge entries as "check-ins," the model predicted the "check-out" (exit) traffic. The model using discrete duration distributions achieved an NDCG@k of over 80%, correctly identifying rush-hour trends.
- Global Events: Analyzing 120,000 tweets from events like the Japan Earthquake and the Royal Wedding.
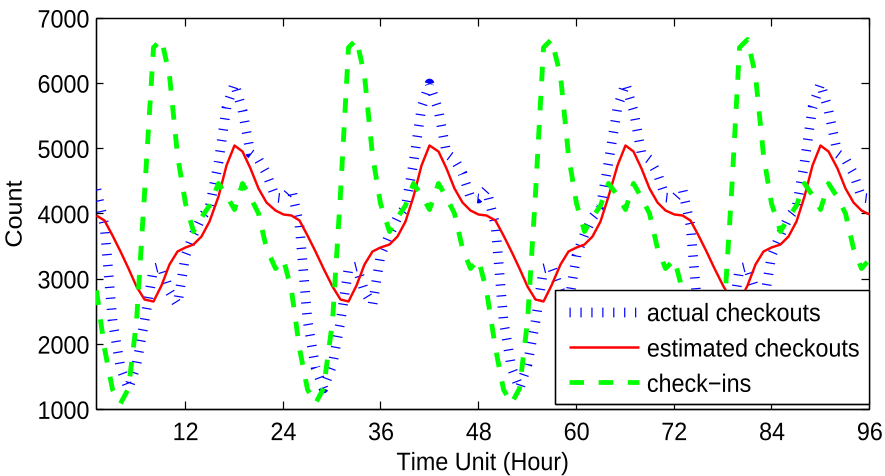 Figure 3: Comparison of estimated exits vs. actual traffic on the Queensboro Bridge.
Critical Insight: Duration as a Semantic Fingerprint
A fascinating byproduct of this research is that duration is a signature of venue type. Fast-food shops and retail stores show rapid decay (short stays), while fitness centers and casual restaurants show distinct, longer duration peaks. When this duration data was added to a kNN classifier, the accuracy of categorizing venues improved significantly, proving that how long we stay is just as descriptive as where we go.
Conclusion & Limitations
The study successfully demonstrates that even noisy social media data can act as a "social sensor" for population density. However, there are inherent limitations: the model assumes users eventually post elsewhere to "close" a stay, and it struggles with users who post only once.
For future work, incorporating trajectory prediction or multi-modal data (like mobile signal headers) could further refine these estimates, potentially turning every smartphone into a real-time node in a global population map.