
CrowdChart: Precision Data Extraction from Charts via Human-in-the-Loop Intelligence
Crowdsourcing-based Data Extraction from Visualization Charts
The paper introduces CrowdChart, a crowdsourcing-based framework designed to extract structured data from visualization charts. It utilizes a micro-task decomposition strategy and a novel Gaussian-based truth inference model to accurately recover numerical data from complex chart images.
TL;DR
Extracting raw data from charts in papers or websites is a surprisingly difficult task for machines, often hitting an accuracy ceiling of 70%. CrowdChart bridges this gap by leveraging the crowd through structured micro-tasks. By accounting for task difficulty (like log-scales) and fixing human alignment errors via a probability-based EM algorithm, it achieves SOTA accuracy while slashing crowdsourcing costs by over 50%.
The "Precision Gap" in Chart Digitization
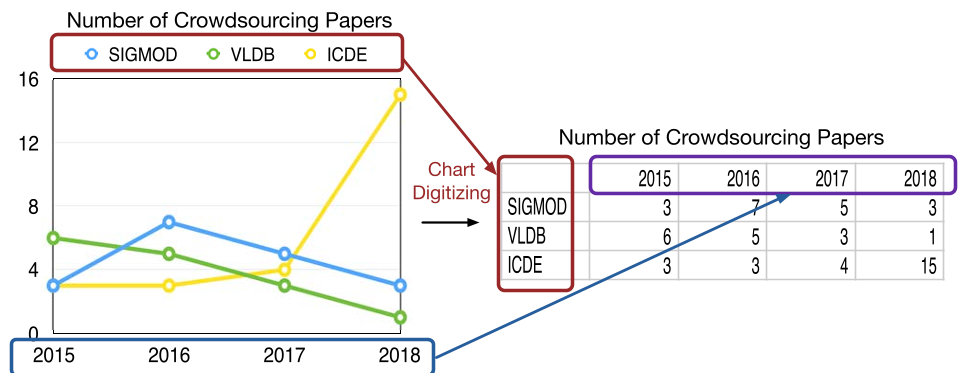
Visualization charts are everywhere, yet they act as "data silos." While humans can easily see a trend, extracting the exact underlying values for re-analysis is error-prone.
- Machine Limits: SOTA automated tools struggle with varied formats and labels, failing to meet the high precision required for scientific analysis.
- Human Fatigue: Asking a worker to digitize an entire chart is overwhelming, leading to "misalignment" where a worker extracts the right number but assigns it to the wrong legend key.
Methodology: Micro-Tasks and Smart Inference
CrowdChart breaks the problem into a pipeline of simple, atomic steps.
1. Task Decomposition
Instead of one big task, the framework uses four micro-task types:
- Preprocessing: Chart classification (Bar vs. Line) and Y-axis scale detection.
- Structure Discovery: Legend identification to map series names.
- Data Extraction: Tuple extraction where workers provide numerical values for specific points.
2. Solving the Alignment Problem
A key innovation is Probability-based Alignment. If a worker provides a sequence of numbers but flips the order, CrowdChart uses the current estimated truth to find the most likely permutation, ensuring that one careless mistake doesn't ruin the worker's quality score.
3. The Quality & Difficulty Model
Unlike standard crowdsourcing, CrowdChart models worker variance () as a function of both Worker Reliability () and Task Difficulty (). For instance, a line chart with a log-scale Y-axis is mathematically treated as more "difficult," allowing the model to be more "forgiving" of slight deviations in worker answers.
Experimental Validation
The authors tested the system on 255 chart instances from the web and academic papers using Amazon Mechanical Turk (AMT).
Performance vs. Cost
CrowdChart features a Confidence-Aware Early Stopping mechanism. Once the statistical confidence of a numerical point reaches a threshold (e.g., 95%), it stops asking for more workers.
- Efficiency: On the "Paper" dataset, CrowdChart hit a 0.9 confidence level at a cost of 320.
- Accuracy: It achieved a Mean Normalized Absolute Distance (MNAD) of 0.74, a 30% improvement over the nearest competitor, T-Crowd.
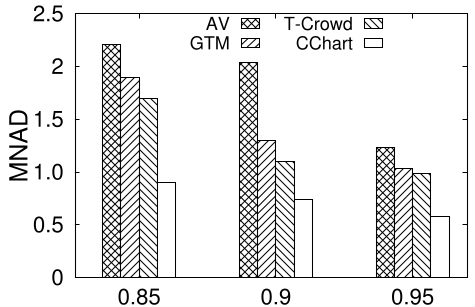 (The charts above illustrate how CrowdChart maintains lower cost across different confidence levels compared to GTM and T-Crowd.)
Critical Insight: Why it Works
The "magic" of CrowdChart isn't just using humans; it's the mathematical modeling of the visual context. By identifying that a chart is a "Stacked Bar" beforehand, the system adjusts its expectations of worker error. This context-aware truth inference is a significant step forward from "black-box" crowdsourcing where all tasks are treated as equally difficult.
Future Outlook
While CrowdChart is highly effective, the next frontier is Active Learning. Integrating a vision model to pre-fill "easy" data points and only sending "uncertain" segments to the crowd could push cost-efficiency even further. For now, CrowdChart provides a robust blueprint for any researcher needing to turn visual "pictures" back into actionable "numbers."