
Stress-Testing the Spectacle: Crowdsourcing Mobile Network Realities at Scale
Crowdsourcing Measurements of Mobile Network Performance and Mobility During a Large Scale Event
This paper presents a comprehensive crowdsourcing measurement study of mobile network performance during the Schloßgrabenfest music festival, involving over 1,000 participants. The study utilizes a custom Android application, Research4Refill, to collect active and passive data across multiple German carriers, revealing extreme performance degradation under high user density.
TL;DR
When 440,000 visitors descend on a city center for a music festival, mobile networks don't just slow down—they fundamentally shift behavior. This study uses a dedicated crowdsourcing app, Research4Refill, to track over 1,000 users at a German festival. It reveals that peak failure rates hit 40% as infrastructure buckles, and users are forced off high-speed LTE onto legacy EDGE connections, regardless of signal strength.
Background: The Infrastructure Blind Spot
Network providers typically provision for daily averages. Large-scale events (festivals, sports) create "shock loads" that are notoriously difficult to analyze from the provider's side alone. Why? Because a provider only sees their own customers. To understand the global impact across different carriers, device types, and actual user mobility, the researchers turned the visitors themselves into a distributed measurement farm.
Methodology: High-Resolution Crowdsourcing
The researchers deployed 50 Bluetooth Low Energy (BLE) Beacons across the festival grounds to augment GPS and network-based location tracking. This allowed them to map user density with high precision even when users turned off GPS to save battery.
The Measurement Stack:
- Active Probes: Periodic HTTP requests to Google/Facebook, DNS lookups, and Traceroutes.
- Passive Stats: Android system metrics (bytes sent/received).
- Location: A hybrid of GPS, WiFi SSID mapping, and BLE Beacons.
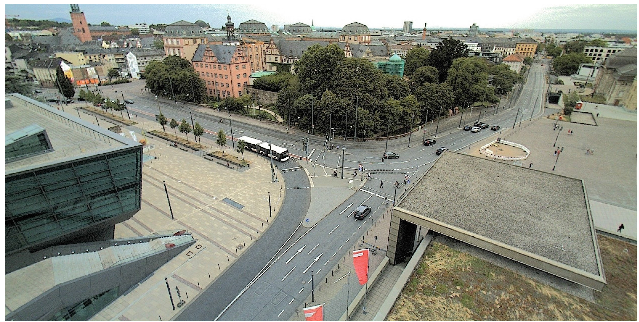 Figure 1: Comparison of the venue on a normal day vs. during the Schloßgrabenfest.
Key Insights: Why Your Phone Dies at Festivals
The study categorized findings into several critical dimensions:
1. The Death of the Request
Between 20:00 and 23:00 (peak festival hours), the failure rate for simple HTTP requests reached nearly 40%. Control groups outside the venue experienced no such degradation.
2. The "LTE Flight" Phenomenon
One of the most significant insights was the shift in network technology. As shown in the researchers' data, the share of participants on LTE decreased as the crowd peaked, while EDGE and UMTS usage increased.
- Insight: This suggests that when LTE cells reach their connection limit, the network's RRM (Radio Resource Management) forces devices to fall back to legacy layers, causing a cascade of performance failures.
3. Carrier Trade-offs: Latency vs. Availability
Interestingly, not all carriers failed the same way:
- Carrier 1: Generally faster load times but the highest failure rate.
- Carrier 4: Slower average load times but the most reliable connections. This suggests different "admission control" strategies—one carrier prioritizes existing connection quality by dropping new ones, while the other tries to serve everyone at the cost of speed.
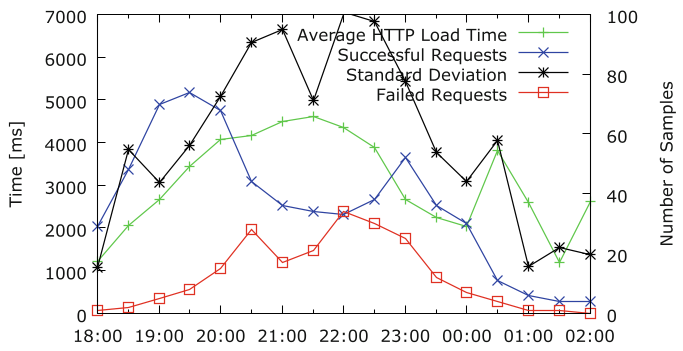 Figure 7: Comparison of failure rates and load times across different German mobile providers.
Mobility and Density
By mapping the transitions between different areas of the venue, the study showed that even in a "packed" festival, there is constant movement. This indicates high potential for Delay Tolerant Networks (DTN), where data could be hopped between moving devices rather than relying solely on the congested cellular backbone.
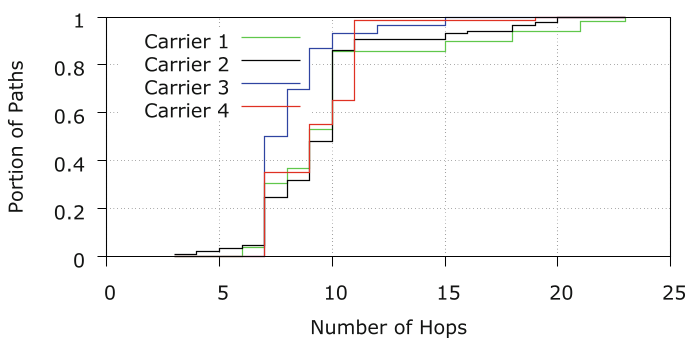 Figure 13: DNS request latency mapped across the venue over time—darker spots indicate "dead zones" of high latency.
Critical Analysis & Conclusion
This work validates app-based crowdsourcing as a powerful tool for urban planning and network engineering. However, it also highlights the Privacy vs. Data wall: many users disabled Bluetooth and GPS, limiting the granularity of the data.
The Takeaway: If you are designing apps for high-density environments, do not assume 4G/5G availability. Your app must be able to move to an offline-first or local-relay model, as the underlying cellular architecture is prone to systematic "downgrade" failures under extreme load.
Future Work: The authors plan to release this dataset to the community to help refine movement models and test new technologies like 5G slicing and specialized access point placement strategies.