
Crowdsourcing Mobile Network Tomography: Transforming Every Smartphone into a Network Probe
Crowdsourcing-based mobile network tomography for xG wireless systems
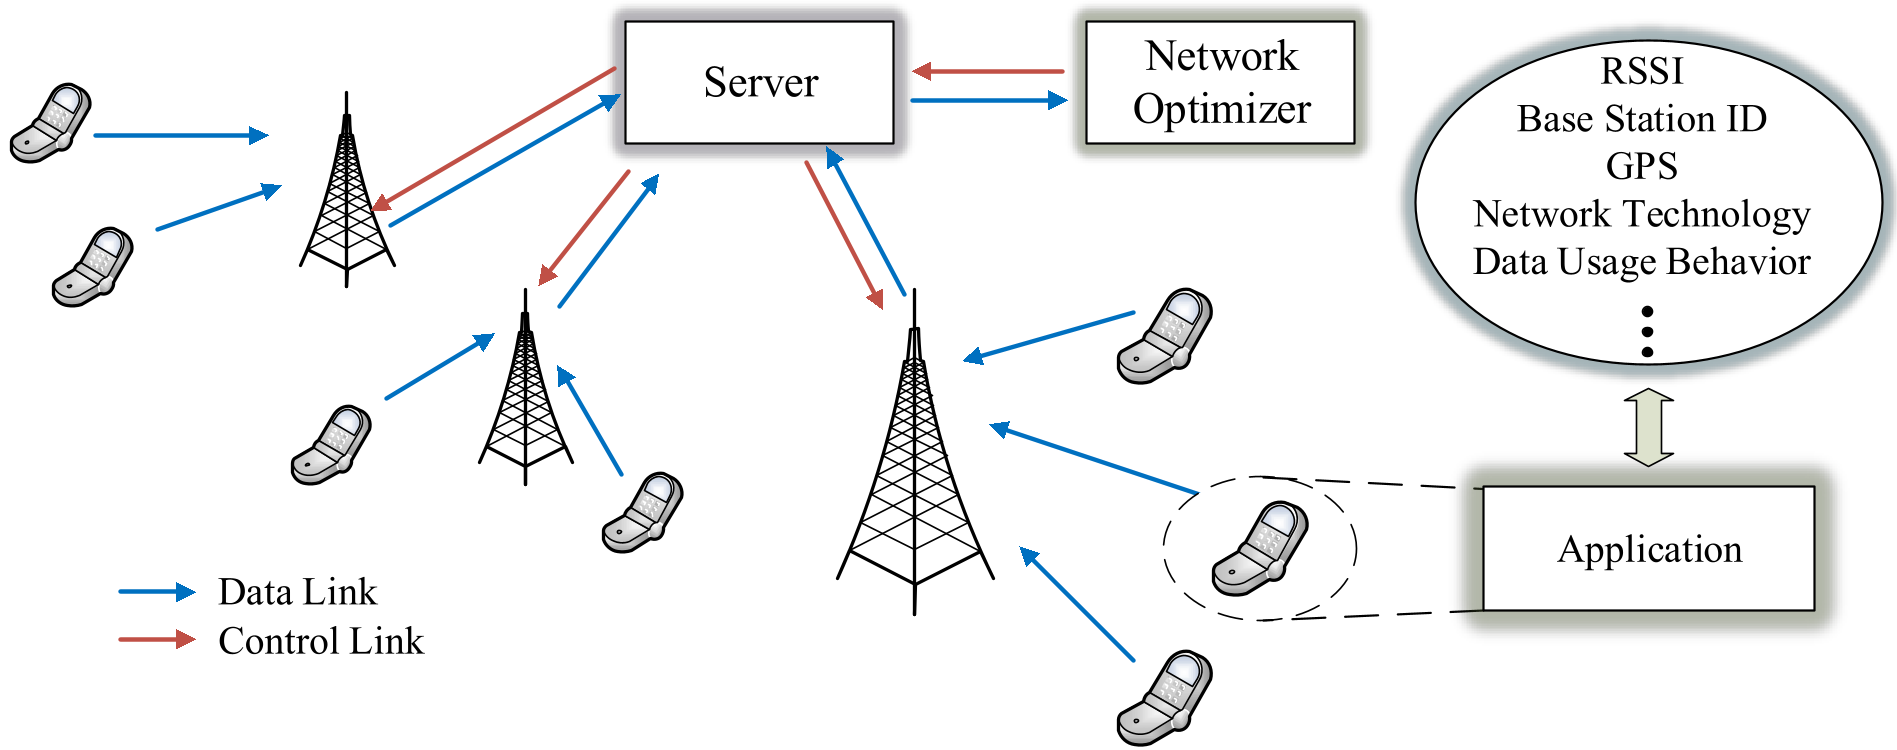
This paper introduces a crowdsourcing-based real-time mobile network tomography framework designed for xG wireless systems. By leveraging an Android-based application to collect channel metrics (e.g., RSSI, SINR) and data usage behavior directly from user terminals, the system enables service providers to monitor network health and optimize resource allocation in real-time.
TL;DR
Managing modern xG (4G/5G/6G) networks is increasingly complex due to skyrocketing user density and heterogeneous services. This paper proposes a crowdsourcing-based real-time network tomography framework that turns user smartphones into intelligent probes. By using a clever dual-layer optimization based on the Kolmogorov-Smirnov (K-S) test, the authors demonstrate a way to monitor network health with 99% less data traffic, effectively solving the classic trade-off between monitoring granularity and mobile battery life.
Context & Motivation: The Opaque Network
Network operators currently rely on proprietary platforms like ActixOne or SmartAir. While effective, these tools typically lack the real-time, ground-level granularity provided by the users' actual devices. Why not just have every phone report its signal strength?
There are two showstoppers:
- Battery Drain: Constant transmission of signal metrics (RSSI, SINR, GPS) kills the smartphone's battery, leading to poor user adoption.
- Network Congestion: If every phone in a cell sends 44-byte packets every millisecond, the resulting "monitoring overhead" would ironically crash the very network it's trying to save.
The authors' insight is rooted in statistical sufficiency: we don't need all the data from every user to understand the distribution of signal quality in a cell. We just need a "statistically representative" sample.
Methodology: The Statistical Scalpel
The core of the paper is a two-staged optimization using the Kolmogorov-Smirnov (K-S) statistic, which measures the maximum difference between two Cumulative Distribution Functions (CDFs).
1. Mobile Terminal Optimization (Local)
Instead of sending every measurement, the smartphone runs Algorithm 1. It compares the CDF of the full measurement set () against a downsampled version (). It finds the largest possible sampling interval that keeps the difference (the K-S statistic) below a threshold ().
2. Server-Side Optimization (Global)
The server level addresses the "too many users" problem. Algorithm 2 randomly selects a subset of users (). It determines the minimum number of users required to reconstruct the cell's SINR distribution within a desired confidence level. This ensures that only 6-8 users in a cell might be reporting at any given time, rather than dozens or hundreds.
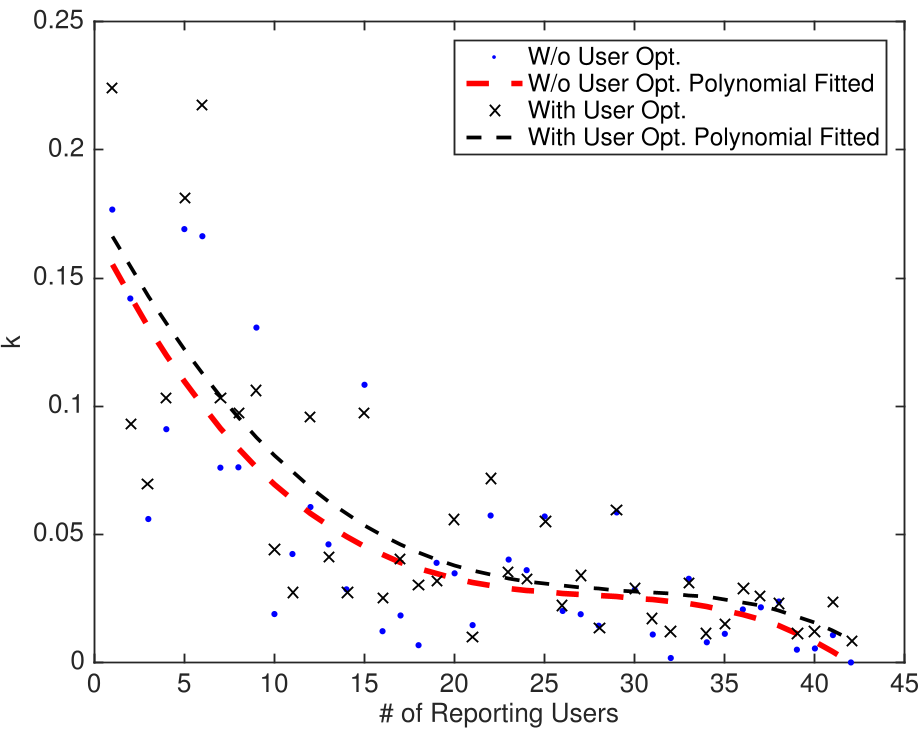 Figure 4 showing how increasing the sampling period impacts the accuracy of the distribution.
Experimental Results: Extreme Compression
The simulations, conducted in a 16 area with 16 base stations, reveal staggering efficiency gains:
- Data Volume Reduction: In a standard scenario, raw data collection generates about 8.8 GB per reporting interval. With the dual-optimization (K-S threshold = 0.2), this volume plummets to just 5.8 MB.
- User Economy: In a cell with 42 active users, the server only needs reports from 8 users to estimate the SINR distribution accurately.
- Sampling Efficiency: The optimized samples represent as little as 0.3% of the original measurement points while maintaining statistical integrity.
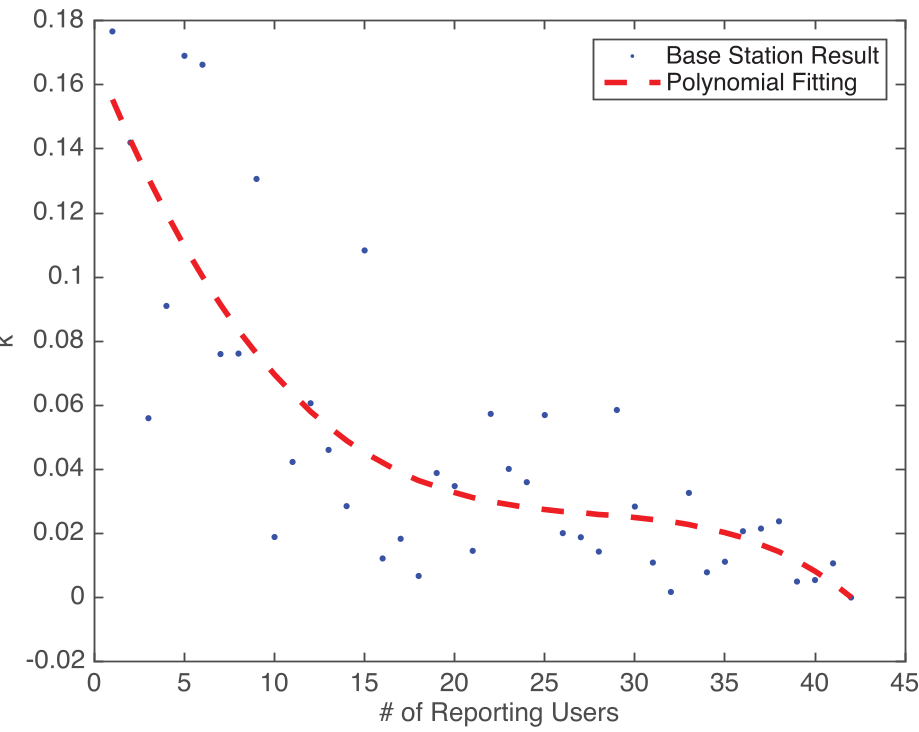 Figure 5: Identifying the "elbow" where adding more users to the reporting pool yields diminishing returns on accuracy.
Critical Insight & The Road Ahead
This work represents a shift from "Big Data" (gathering everything) to "Smart Data" (gathering what's statistically significant). By moving the initial data thinning to the Edge (the smartphone), the system becomes sustainable.
Limitations: The current model assumes uniform user behavior and relatively simple path-loss. In a real-world dense urban environment with massive MIMO and beamforming, the SINR distributions might be far more "jagged," potentially requiring more complex statistical checks than a basic K-S test.
Future Outlook: The logical next step is integrating this with Machine Learning. Instead of just monitoring the present, operators could use this high-resolution crowdsourced data to train predictive models that anticipate service outages before they happen, effectively moving from reactive to proactive network management.