
CSI: Deciphering the Macro-Dynamics of Social Influence
CSI: Community-Level Social Influence Analysis
The paper introduces CSI (Community-level Social Influence), a novel framework for analyzing information propagation in social networks at the community scale. By generalizing the Independent Cascade (IC) model, it aggregates individual node interactions into macro-level influence patterns between social clusters, achieving state-of-the-art graph summarization for diffusion dynamics.
Executive Summary
TL;DR: The CSI (Community-level Social Influence) model shifts social network analysis from individual "ping-pong" interactions to macro-level "community-to-community" dynamics. By summarizing massive social graphs into a few dozen influential clusters, it provides a highly interpretable map of how information cascades happen in the real world.
Context: Positioned at the intersection of Graph Summarization and Influence Maximization, this work is a "SOTA Refinement." It takes the classic Independent Cascade (IC) model and applies a hierarchical lens to solve the complexity and overfitting issues inherent in large-scale social data.
Problem & Motivation: The Fog of Individual Data
In modern social networks with millions of users and billions of edges, looking at node-to-node influence is like trying to understand climate change by tracking every individual raindrop.
- Overfitting: Estimating a unique probability for every single edge requires an impossible amount of data.
- Cognitive Overload: A graph with 10 million edges is uninterpretable for a human analyst or a marketing strategist.
- Structural Blindness: Existing summarization tools aggregate nodes based on "who they know" (structure), but CSI argues we should aggregate them based on "how they spread info" (behavior).
Methodology: The Hierarchical Approach
The core innovation of CSI is treating influence as a property shared by communities. If User A and User B behave similarly in cascades, they belong to the same functional community.
1. The Architecture
The process begins by creating a Hierarchical Decomposition (H) of the graph (a binary tree of nodes). The algorithm then searches for an optimal Cut—a horizontal slice across this tree that defines a set of disjoint communities.
2. Learning Influence Strengths
For any given partition, CSI uses an Expectation-Maximization (EM) algorithm. Since we don't know which specific node in a community triggered an infection, the EM treats "who is the actual influencer" as a latent variable.
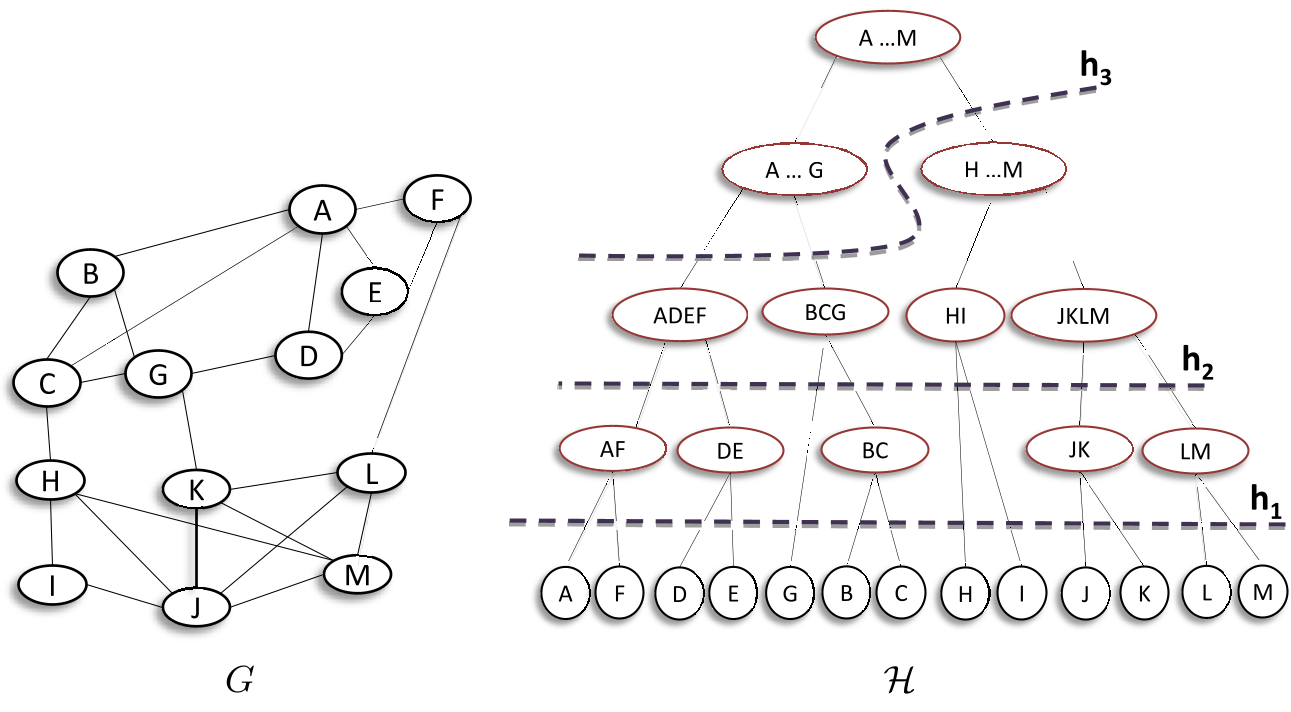 Figure 1: Illustration of a hierarchical decomposition where different "cuts" (h1, h2, h3) represent different levels of model granularity.
3. Model Selection: BIC vs. MDL
To prevent the model from just staying at the leaf level (maximum complexity), the authors use:
- BIC (Bayesian Information Criterion): Penalizes the number of parameters.
- MDL (Minimum Description Length): Views the model as a compression task—the best model is the one that describes the data in the fewest bits.
Experiments: What the Data Says
The authors tested CSI on three datasets: Yahoo! Meme, Flixster, and Twitter.
Key Insights:
- Influence vs. Connectivity: Interestingly, high internal connectivity in a community does not always mean strong internal influence. Some dense clusters are "echo chambers" with stagnant information, while others are highly active.
- Acyclic Flow: The resulting community-level propagation graphs (like Figure 5) are nearly acyclic. This suggests that information in social networks has a clear "arrow of time" and directionality—from early adopter clusters to mainstream consumers.
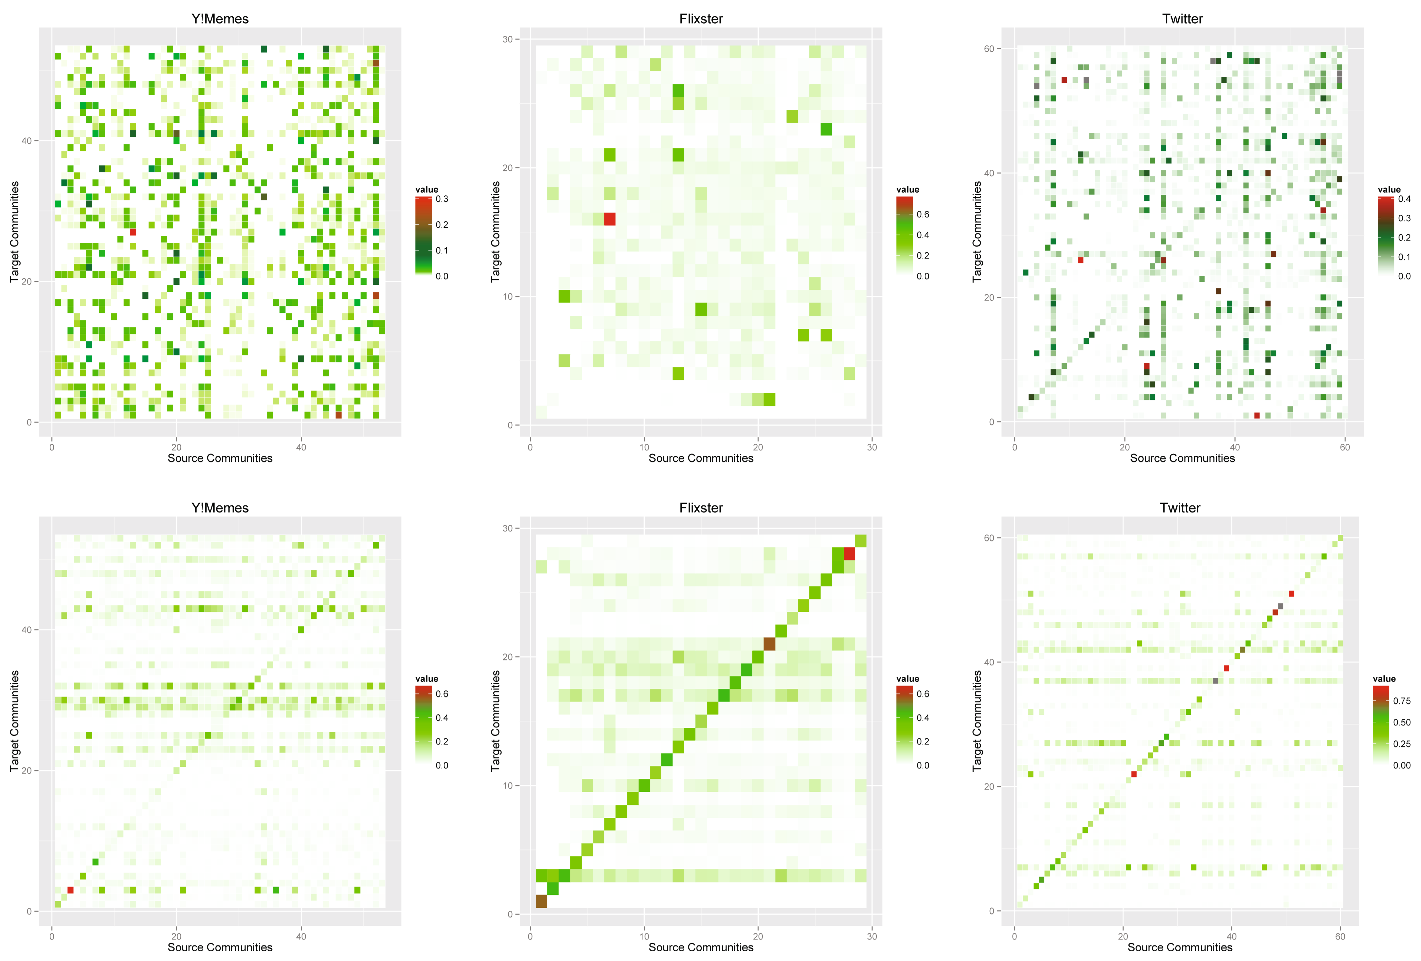 Figure 2: The CSI Propagation Network for Flixster. Edge thickness represents the strength of inter-community influence. Note the clear flow from the 'Start' (External Source) node.
Influence Maximization
CSI accurately identified "Super-Communities." In all three datasets, targeting a few specific communities could explain the vast majority of the total reach (Spread), confirming that certain clusters act as the "engine rooms" of viral trends.
Critical Analysis & Conclusion
Takeaway: CSI proves that "Influence" is a collective trait. By grouping users into functional blocks, we can finally visualize the "skeleton" of information diffusion in massive networks.
Limitations:
- Static Hierarchy: The model relies on a fixed hierarchy (METIS) generated at the start. If the initial clustering is poor, the influence model suffers.
- Discrete Time: It still operates on discrete time steps, which may miss the nuances of high-frequency social interactions.
Future Outlook: This framework sets the stage for "Hierarchical Marketing." Instead of finding 1,000 influential individuals, companies can identify 5 influential communities and tailor strategies to the specific cultural or functional signatures of those clusters.