
Decoding the Social Pulse: An Ontology-Based Metric for Cultural Heritage Sensitivity
What's the Matter with Cultural Heritage Tweets? An Ontology -- Based Approach for CH Sensitivity Estimation in Social Network Activities
The paper presents a quantitative methodology for estimating "Cultural Heritage Sensitivity" (CH-Sensitivity) by analyzing Twitter data through an ontology-based approach. The authors developed a system that combines Natural Language Processing (NLP) and Business Intelligence (BI) to extract CH-related entities and map them to DBPedia semantic categories, identifying user engagement across different Italian cities.
TL;DR
Researchers from the University of Naples Federico II have developed a quantitative framework to measure how "sensitive" social media users are to Cultural Heritage (CH). By mapping 400,000 tweets to semantic ontologies like DBPedia, they established that cultural interest (26.04%) actually outperforms sports and medicine in Italian social discourse, especially during major events like the Venice Biennale.
Background & Positioning
In the digital age, a hashtag like #culturalheritage isn't just a label—it's a data point. However, cultural organizations often struggle to quantify the "vibe" of their audience. This paper shifts the focus from purely qualitative sentiment analysis (which is messy and complex) to a Business Intelligence (BI) approach. It sits at the intersection of Big Data analytics and Digital Humanities, aiming to provide a measurable "Performance Indicator" for cultural engagement.
The Core Challenge: Noise in the Stream
Twitter data is notoriously noisy, short, and unstructured. Prior works often failed because:
- Scale: Deep NLP models struggle with the sheer volume of "Big Data."
- Context: A mention of a city isn't necessarily a mention of its heritage.
- Baselines: Without a reference point (like "how much do people talk about sports?"), a cultural sensitivity score has no meaning.
Methodology: From Tweets to Semantic Weights
The authors propose a multi-stage pipeline:
- Filtering: Cleaning noise and normalizing text.
- Ontology Matching: They selected seven semantic categories—ART, ARTWORK, ARTIST, SCULPTOR, MUSEUM, MONUMENT, and HUMANIST—cross-verified with the Getty Art & Architecture Thesaurus (AAT).
- Weighting (CHRI): Instead of a binary "is this CH or not?", they created the CH Correlation Index:
This ensures that a tweet densely packed with cultural terms is weighted more heavily than one that mentions a museum in passing.

Experimental Insights
Using the TIM Big Data Challenge dataset, the researchers analyzed four major Italian cities: Naples, Bari, Venice, and Rome.
Key Findings:
- The Baseline: The overall CH Global Density was 26.04%.
- The Competition: To prove this wasn't just "noise," they measured Medicine (15.09%) and Sport (16.83%). Cultural Heritage is a more dominant topic in these urban social pulses than previously thought.
- Event Correlation: In Venice, CH sensitivity skyrocketed to 74.15% during the Biennale. In Naples, they were able to isolate 80 individual "power users" whose social activity directly correlated with local physical exhibitions.
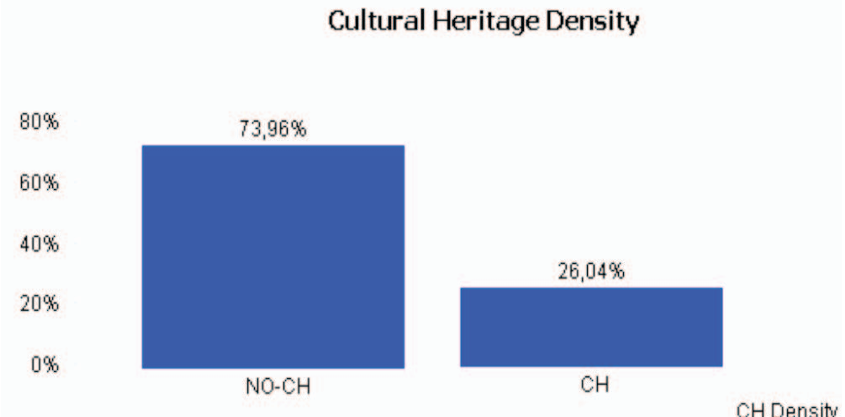 The chart above illustrates the dominant presence of CH-related discourse across the analyzed timeframe.
Critical Analysis & Future Outlook
Strengths: The use of a BI engine (QlikView) for ontology matching is a brilliant "engineering first" approach. It bypasses the need for intensive GPU-based transformer models while maintaining high accuracy through structured semantic hierarchies.
Limitations: The current model relies heavily on entity matching. It might miss "latent" cultural sensitivity where the user doesn't use specific keywords but describes an experience. Furthermore, the dataset is localized to Italy, a country with an exceptionally high density of CH resources; results might vary in less "museum-dense" regions.
The Takeaway for the Industry: For museum curators and city planners, this proves that social media isn't just a megaphone—it's a thermometer. By monitoring the CH-SPI (Sensitivity Performance Indicators), organizations can move from "guessing" to "measuring" their impact on the public consciousness.