
SVM vs. Churn: Maximizing Retention Profits in the Indonesian Banking Sector
Customer Churn Analysis and Prediction Using Data Mining Models in Banking Industry
This paper proposes a data mining framework using the CRISP-DM methodology to predict customer churn at XYZ Bank, Indonesia. By evaluating five classification algorithms across different sampling ratios, the study identifies Support Vector Machine (SVM) with 50:50 class sampling as the optimal model for identifying potential churners.
TL;DR
Customer churn is a silent profit-killer in the banking industry. This study analyzes 131,548 customer records from a major Indonesian bank (XYZ Bank) to build a predictive model. The key takeaway: Accuracy is a trap. By switching from stratified sampling to a 50:50 class distribution and using a Support Vector Machine (SVM), the authors developed a model capable of saving an estimated IDR 456 Billion in threatened funds.
Background: The Retention Imperative
In the hyper-competitive Indonesian banking landscape, losing 1.5 million customers annually isn't just a statistic—it's a massive financial leak. Since acquiring a new customer is up to 6x more expensive than keeping an old one, the ability to predict who will leave is a critical competitive advantage.
The Problem: The "Accuracy Paradox" in Imbalanced Data
Most banking datasets are heavily imbalanced; at XYZ Bank, only about 12% of the data consists of churned customers.
- The Trap: If a model simply predicts "no one will churn," it might achieve 88% accuracy but have zero business value.
- The Solution: The researchers focused on Recall (Sensitivity)—the ability to find as many actual churners as possible—even if it means a slight increase in "false alarms" (False Positives).
Methodology: The CRISP-DM Framework
The study utilized the CRISP-DM (Cross Industry Standard Process for Data Mining) framework, moving from business understanding to deployment.
1. Feature Engineering
They extracted 57 attributes from the bank's data warehouse, categorized into:
- Demography: Age, tenure (vintage), and profession.
- Transactions: Cash in/out, EDC (Electronic Data Capture) usage, and channel-specific behavior.
- Balance: Average balances over 1, 3, and 6-month windows.
2. Experimental Setup
The authors tested five core algorithms: Decision Tree, Neural Network, SVM, Naïve Bayes, and Logistic Regression. They specifically tinkered with the sampling ratio to see how it affected model performance.
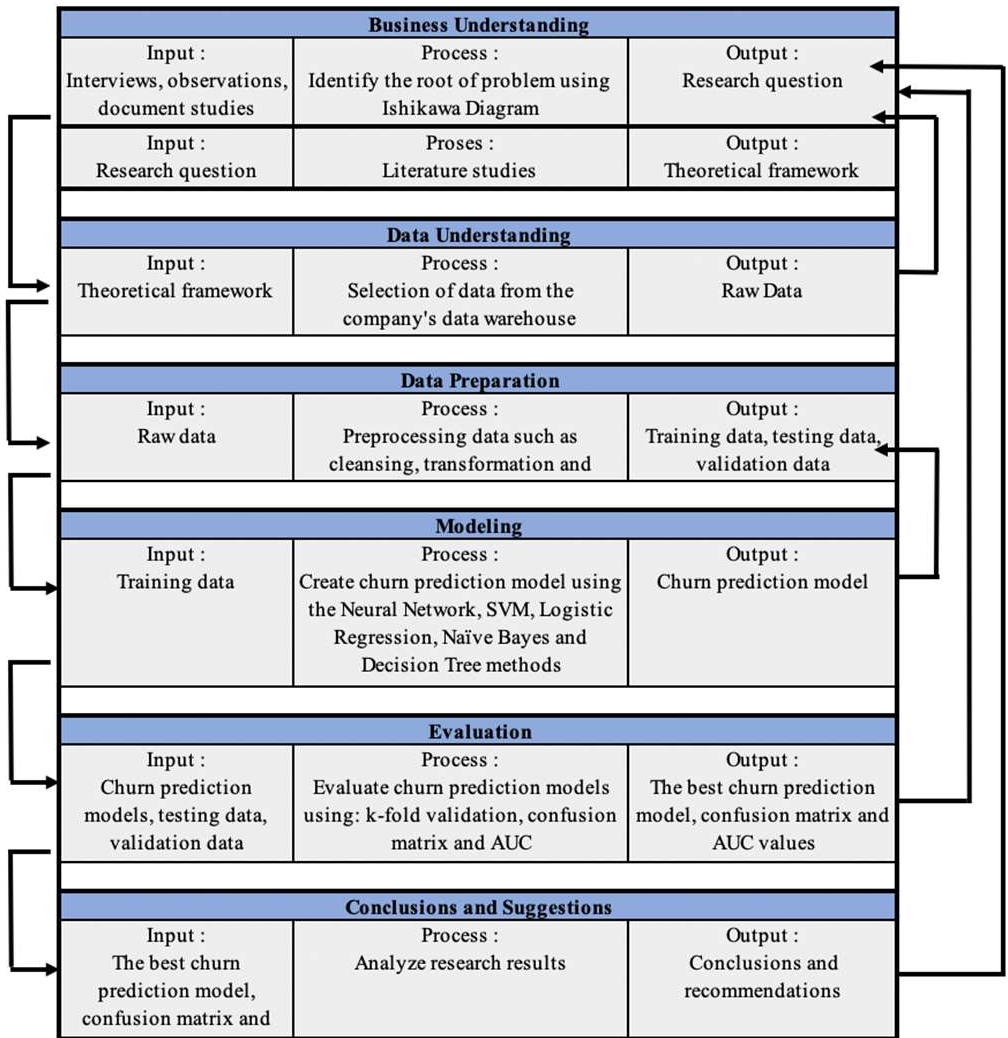 Fig 1: The CRISP-DM Research Workflow used to iterative improve the churn model.
Performance: Why SVM Won
The results revealed a stark contrast between sampling methods. While "Stratified" sampling (keeping the original imbalance) yielded high accuracy, the 50:50 Sampling was the only way to get Recall levels above 70%.
| Method | Sampling | Accuracy | Recall | AUC |
|---|---|---|---|---|
| SVM | Stratified | 92.65% | 13.92% | 0.750 |
| SVM | 50:50 | 73.68% | 73.24% | 0.811 |
| Logistic Regression | 50:50 | 74.57% | 72.68% | 0.815 |
While Logistic Regression was a close second, SVM provided the best balance of predictive power and financial benefit.
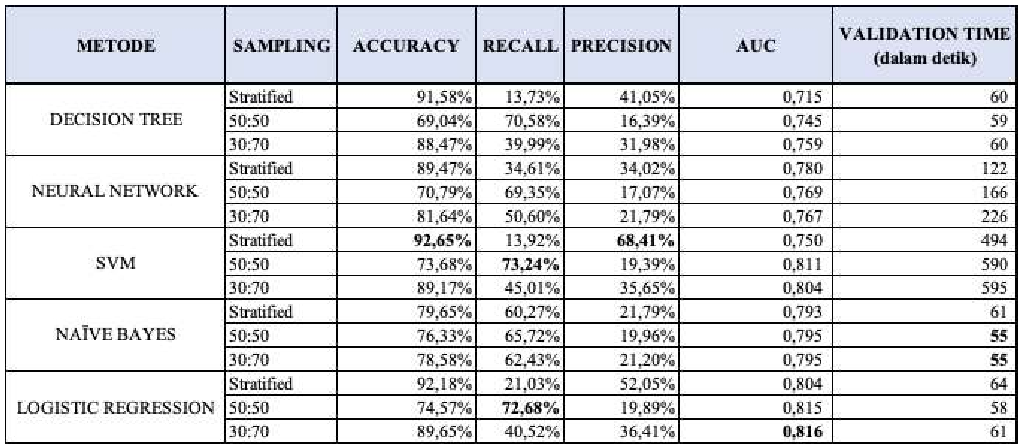 Fig 2: Detailed performance metrics showing the superiority of 50:50 sampling for Recall.
The "Profit" Metric: Translating Math to Money
The most impressive part of this research is the Mapping to Business Value. The authors didn't just report F1-scores; they calculated the "Held Funds" (Profit) vs. "Follow-up Costs" (Loss).
- The Logic: If we predict a churn correctly (True Positive), we save the customer's average balance (~IDR 63 Million). If we predict incorrectly (False Positive), we waste the cost of a marketing call/visit (~IDR 15,000).
- The Outcome: The 50:50 SVM model resulted in a net profit of IDR 456.5 Billion, significantly higher than models that favored accuracy over recall.
Critical Insight: The Top Predictors
Through the modeling process, five attributes emerged as the "smoking guns" of customer churn:
- Vintage (Tenure): How long they've been with the bank.
- EDC Transaction Volume: Activity at point-of-sale terminals.
- EDC Transaction Amount: The value of those transactions.
- Average 1-Month Balance: Sudden drops in liquidity.
- Age: Demographic lifecycle stages.
Conclusion & Limitations
This paper demonstrates that in the banking sector, data sampling strategy is as important as the algorithm choice. By forcing a 50:50 balance, the model becomes hypersensitive to churn signals that are otherwise drowned out by the majority of stable customers.
Future Directions: The authors suggest incorporating unstructured data—such as customer complaint logs and social media sentiment—to further refine the "dissatisfaction" signal before the customer decides to close their account.