
Beyond Words: Unmasking Cyberbullies through Social Network Topology
Mining Patterns of Cyberbullying on Twitter
This paper presents a large-scale analysis of topological features on Twitter for cyberbullying detection, moving beyond traditional text-only methods. By utilizing a dataset of 900,000 tweets and interaction networks, the authors identify a subset of five highly discriminative network features—including Contribution Index and Clustering Coefficient—that significantly distinguish bullies and victims from normal users.
TL;DR
While most cyberbullying detection tools focus on what is being said (textual analysis), this paper shifts the lens to how users interact. By analyzing a massive Twitter interaction network of 900,000 tweets, the researchers identified specific structural "fingerprints"—such as imbalances in sent vs. received messages and local clustering deviations—that distinguish bullies and victims from the "normal" population with high accuracy.
Background: The Hidden Structure of Harassment
Cyberbullying is not just a series of isolated offensive comments; it is a social phenomenon characterized by repetition and power imbalance. Traditional detection methods struggle with scalability and the nuance of language (sarcasm, acronyms). This paper positions itself as a structural study, arguing that the Online Social Network (OSN) topology—the map of who talks to whom—contains vital clues that text alone might miss.
The Problem: The Manual Bottleneck
Previous research suffered from three fatal flaws:
- Scale: Manual labeling of 4,000 tweets cannot keep up with the millions posted daily.
- Bias: Keyword filtering (searching for "bad words") ignores subtle harassment.
- Context: Ignoring the "neighborhood" of a user (who their friends are) ignores the social pressure inherent in bullying.
Methodology: Automated Labeling and Topological Analysis
The authors constructed a directed weighted graph where edges represent @-mentions. They then used a two-pronged automated labeling strategy:
- Modified BTC: A classifier that identifies roles (bully, victim, etc.) using an expanded "bad word" dictionary.
- WKB Lexicon: An emotional analysis measuring Valence (pleasure), Arousal (activity), and Dominance (power).
Key Breakthrough: The 5 Informative Metrics
After testing dozens of metrics, five emerged as "Gold" features for identifying anomalies:
- Degree (In/Out): Total connections.
- Message Volume: Total activity.
- Clustering Coefficient: How "knit" a user's friend group is.
- Contribution Index (): The balance between messages sent and received.
- Jaccard’s Coefficient: The overlap between two users' social circles.
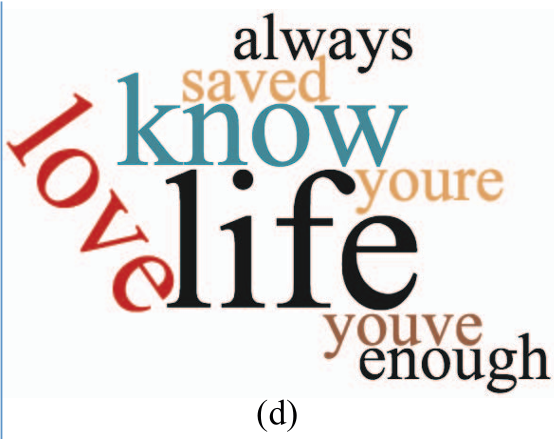 Figure 1: Visual representation of the emotional "vibe" of different user types. Bullies lean toward profanity; victims exhibit high arousal and distress.
Experimental Insights: Spotting the Anomaly
The research team found that by plotting these features against each other, bullies and victims appear as "outliers" from the average user.
- The Power Balance: Bullies typically have a positive Contribution Index (sending more than they receive), while victims have a negative Index (received messages far outweigh their responses).
- The Social Trap: Victims often show a lower Jaccard’s Coefficient in their ego-networks, suggesting they are being targeted by users outside their immediate "safe" social circle.
- Clustering: Curiously, bullies often exist in higher-than-average clustering environments, suggesting they may operate within "reinforcing" groups of peers.
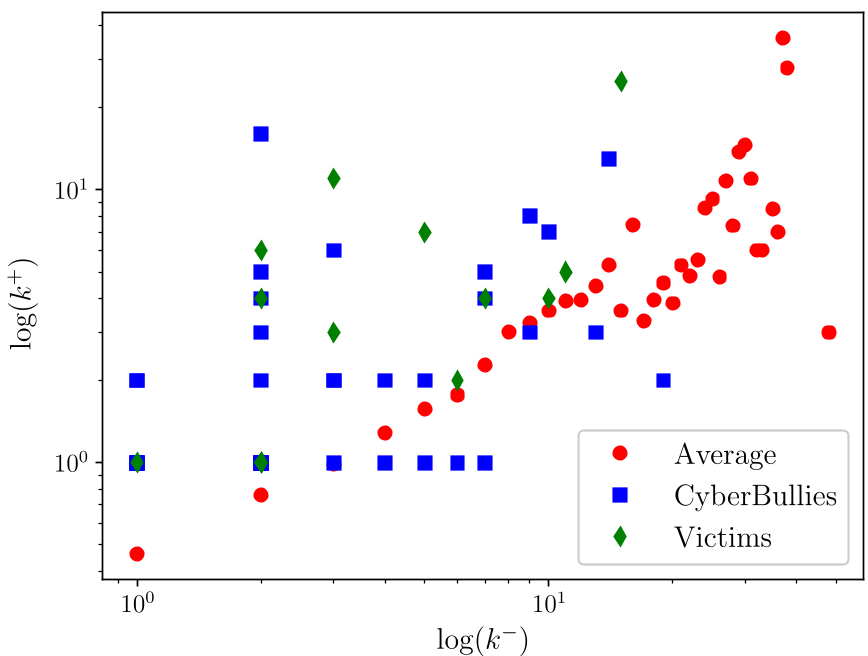 Figure 2: The "Normal" trend line vs. Bullies and Victims. Notice how bullies and victims deviate significantly from the red average circles.
Critical Analysis & Conclusion
Takeaway
This work proves that cyberbullying leaves a structural "scar" on social networks. Detectors should not just look for "hate speech"; they should look for asymmetric interaction patterns.
Limitations
- Platform Specificity: The @-mention interaction model on Twitter might not translate perfectly to Reddit or Facebook's "walls."
- Precision vs. Recall: While structural features identify "anomalous" users, they might also catch high-activity celebrities or news bots if not combined with text features.
Future Outlook
The next step in this field is likely Real-time Graph Monitoring. Imagine a system that flags not just a toxic tweet, but a toxic interaction flow as it develops, allowing platforms to intervene before emotional harm escalates.