
Visualizing the Invisible: Enhancing Healthcare Cyber-Resilience via Behavioral Analytics
A study into data analysis and visualisation to increase the cyber-resilience of healthcare infrastructures
This paper proposes a cyber-resilience framework specifically for healthcare infrastructures, utilizing machine learning and advanced data visualization to detect anomalous network behavior. By profiling typical data flows in critical hospital servers (Active Directory, Patient Administration, and Electronic Prescribing), the system identifies "Unknown" port mappings and potential malicious activity like ransomware.
TL;DR
In the wake of devastating attacks like WannaCry, this research introduces a specialized security framework for healthcare. By combining Machine Learning with Force-Directed Graph Visualization, the system profiles internal network behavior to identify malicious anomalies that traditional firewalls miss. It transforms raw network logs into intuitive maps, allowing security officers to "see" threats within complex hospital infrastructures.
The Healthcare Vulnerability Paradox
Modern hospitals are digital fortresses built on fragile foundations. While they generate terabytes of life-critical data (EHRs, sensor feeds, pharmacy records), their internal networks often rely on:
- Legacy Systems: Outdated protocols (like SMB) that are easy targets for worms.
- Insecure Medical Devices: Pacemakers and ventilators that lack the processing power for modern encryption.
- Shared Environments: PCs utilized by multiple rotating staff members across disparate systems.
The authors argue that the "one size fits all" security approach fails here. Once an attacker enters via a backdoor, there is a total lack of internal situational awareness.
Methodology: Mapping the Network Chaos
The core of the proposed solution is a multi-stage pipeline designed to provide Defense-in-Depth.
1. Data Collection & Pre-processing
The system captures data using netstat -abn from three high-value targets:
- Active Directory (AD): The keys to the kingdom (user accounts/passwords).
- Patient Administration System (PAS): The hub of patient demographics.
- Electronic Prescribing (EP): Where medication doses are controlled.
2. The Yifan Hu Visualization Strategy
To make sense of thousands of connections, the authors employ the Yifan Hu algorithm, a multilevel force-directed graph technique. It uses a "bodies and forces" metaphor:
- Coarsening: Simplifies the graph to find global structures.
- Refinement: Recursively adds detail back in to find local anomalies.
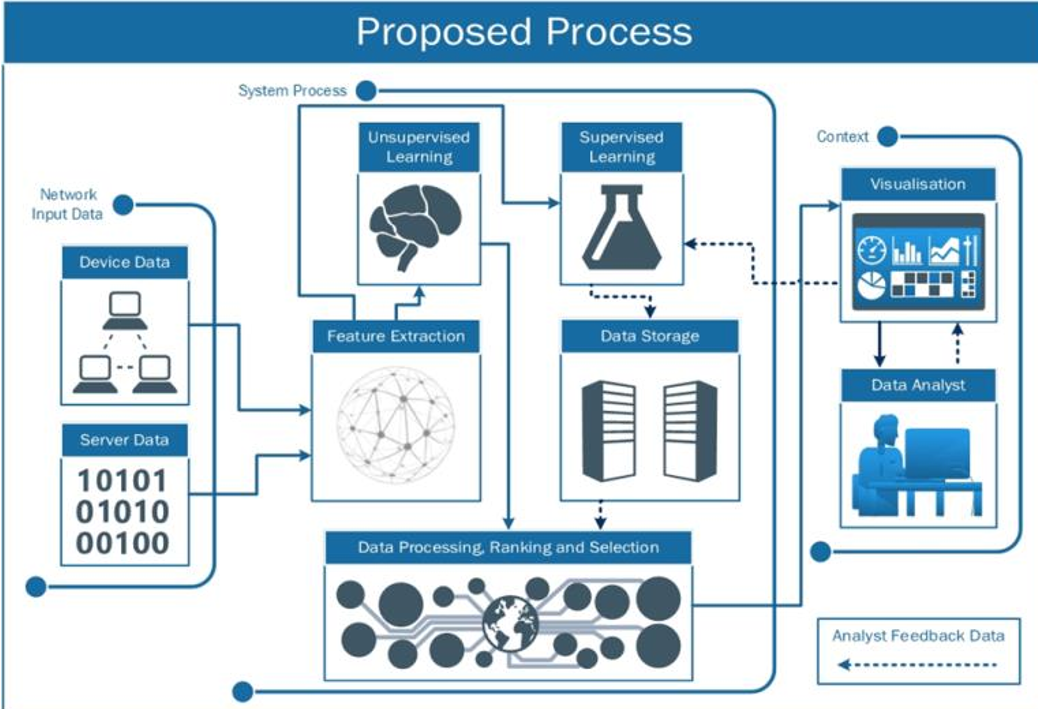 Table 1: Example of raw port mappings used for behavioral profiling.
Experimental Insights: Finding the Needle
The researchers demonstrated that by removing "low-risk" (known/benign) traffic, malicious patterns emerge clearly.
- Active Directory Analysis: The system highlighted clusters associated with the "Unknown" process on Port 445—the very port exploited by WannaCry.
- Isolation of Threats: In the PAS server visualization, the system successfully isolated three small collections of ports running unknown processes that were otherwise buried in the noise.
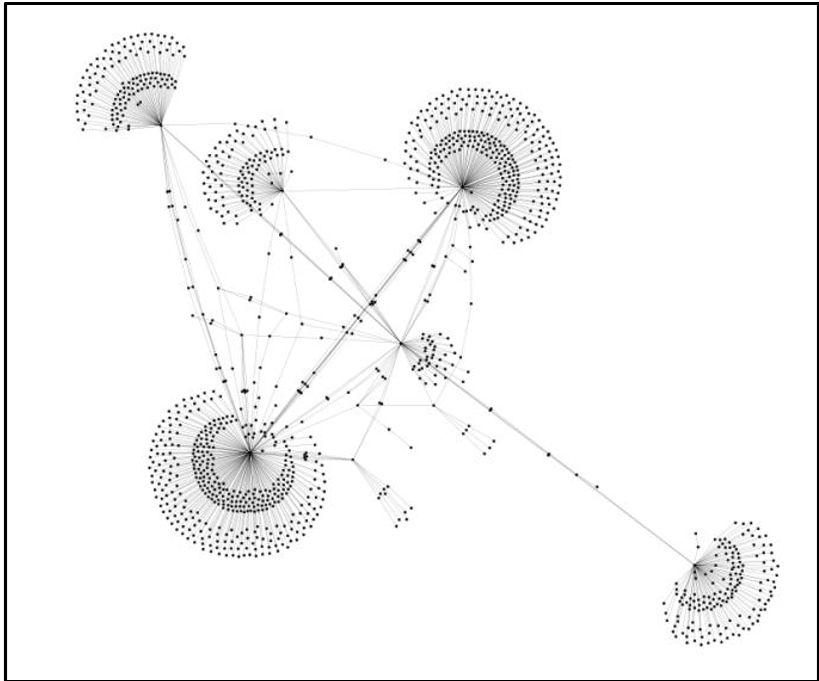 Figure: The raw complexity of an AD server's network connections before filtering.
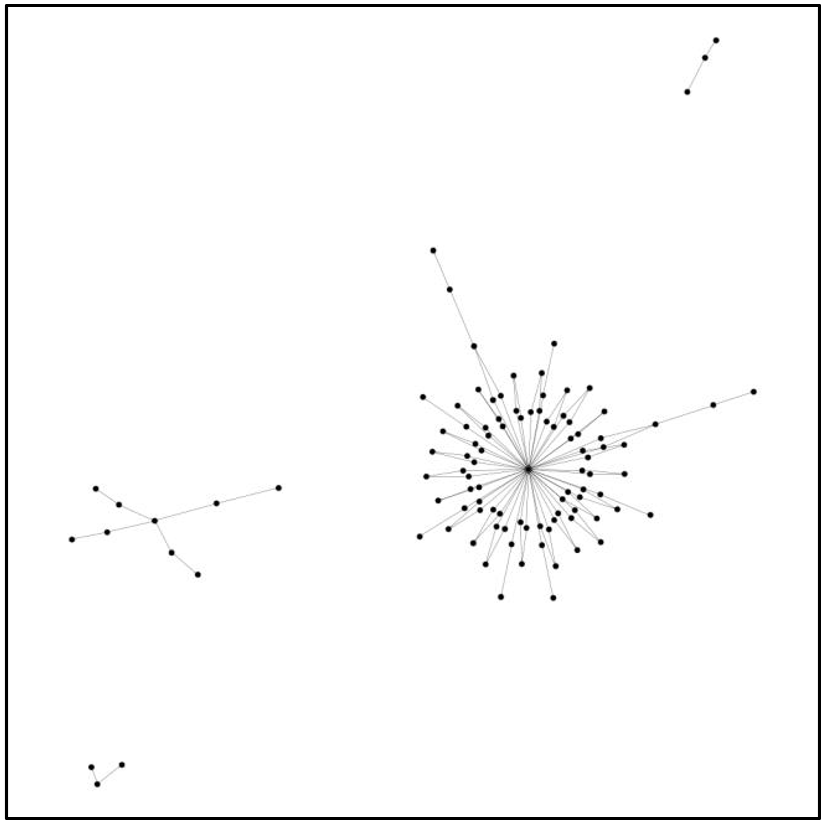 Figure: After pre-processing, anomalous "Unknown" clusters are clearly visible, demanding immediate investigation.
Critical Analysis & Future Outlook
Takeaway: This work proves that visualization is not just "aesthetic"—it is a functional security tool. By reducing the cognitive load on human analysts, it enables faster response times to zero-day threats.
Limitations:
- Manual Cleansing: The current "low-risk" removal is partially manual, which won't scale to thousands of servers without robust automated ML filtering.
- Snapshot Bias: The data is a snapshot; true behavioral profiling requires longitudinal analysis to identify "traveling" attackers or subtle privilege escalation over time.
Future Work: The authors aim to automate the ML feedback loop, allowing the system to learn from the analyst's decisions, effectively creating a "Digital Immune System" tailored to the unique configuration of each hospital.