
Reinventing the Peloton: Data-Driven Summarization for Modern Cycling Reporting
Data-driven Summarization and Synchronized Second-screen Enrichment of Cycling Races: Using Live and Historical Sports Data to Reinvent Traditional Reporting
This paper introduces a multi-modal framework for "Data-driven Summarization" and "Synchronized Second-screen Enrichment" of professional cycling races. By integrating IoT sensor data (Velon/Gracenote) with computer vision (OpenPose/EAST), the system provides personalized highlights and location-aware historical content for the Tour de France.
TL;DR
The golden age of "watching the paint dry" for four hours of a cycling stage is over. This paper presents a technical pipeline to save traditional broadcasting by using live IoT sensors and Computer Vision to generate personalized race summaries (e.g., "just show me my favorite team's attacks") and a synchronized second-screen app that triggers historical stories based on the rider's real-time GPS location.
Problem & Motivation: The "Boredom" Gap
Professional cycling faces a grim reality: viewership is aging and declining. The sport is inherently "slow-burn," and traditional coverage fails to highlight the tactical nuances—like a team slowing the peloton to save energy—unless a human commentator catches it.
The authors identify a massive "missing gap": the inability to translate raw sensor data (heart rate, power, speed) into narrative elements. Why not use the data to tell the story automatically? By bridging IoT and Video, they aim to capture the interest of digital-native fans who prefer short-form, personalized interactions over 5-hour linear broadcasts.
Methodology: The Fusion of CV and IoT
The methodology is split into two core innovations: Data-Driven Summarization and Location-Based Enrichment.
1. Data-Driven Summarization
The system doesn't just look at video; it "listens" to the data first.
- Sensor Event Detection: By comparing a rider's speed against the group median (using Gracenote/Velon APIs), the algorithm identifies "attacks" or "breakaways."
- Vision-Based Validation: To ensure the video matches the data, the system uses OpenPose to detect skeletons in the shot, validates they are on a bike via YOLO-LITE, and then crops the torso to identify the team jersey using Generalized-Mean (GeM) features.
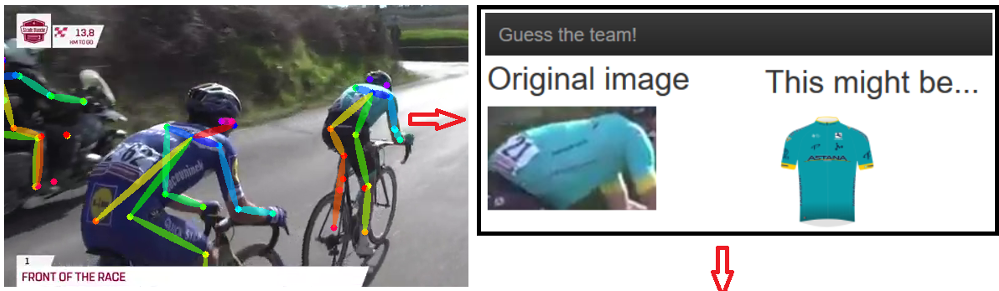 Figure: The pipeline for jersey recognition and shot classification.
2. The Second-Screen Synchronization
How do you keep a viewer engaged during a flat 100km stretch? The authors built a "Cycling Heritage" engine.
- Geolocalization: The system extracts the "Kilometers to Go" from the TV broadcast using EAST (Efficient and Accurate Scene Text detector) and Tesseract OCR, achieving 90% accuracy.
- Synchronized Content: As riders pass a specific coordinate (GPS), the second screen pushes multimedia content—like a story about a legendary crash that happened on that exact hill 50 years ago.
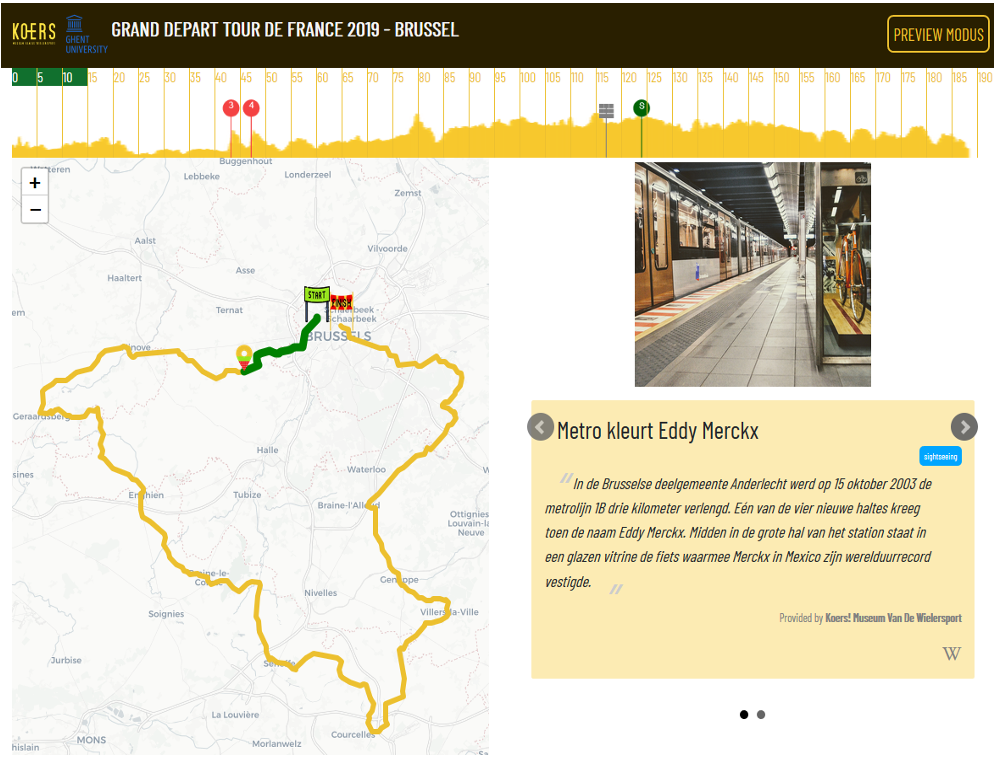 Figure: The mobile interface showing live race location synchronized with historical POIs.
Experiments & Results: Real-World Testing
The system was field-tested during the Grand Départ of the 2019 Tour de France.
- Accuracy: The text recognition for race overlays proved robust, and the jersey extraction pipeline successfully handled "close-up" and "small group" shots.
- User Feedback: 52% of the test audience admitted traditional broadcasting is "too boring." Interestingly, 75% of participants favored the "personalized story" approach, where they could define the length of the summary and the specific teams of interest.
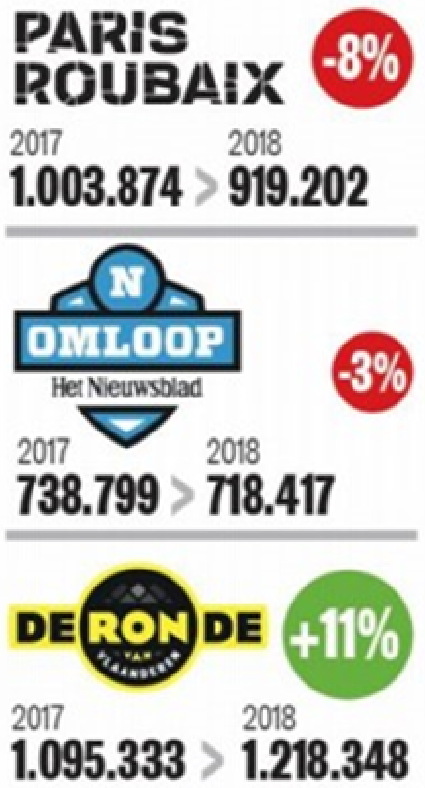 Figure: The decline in viewership that motivated this research.
Critical Analysis & Conclusion
Takeaway
The paper successfully demonstrates that semantic enrichment is no longer just a manual task for editors. By treating a sports race as a stream of geospatial and physiological data points, we can automate the creation of "micro-stories" that appeal to modern viewers.
Limitations & Future Work
- Computational Cost: While text detection is fast, the paper notes that real-time vision processing (OpenPose + jersey matching) adds latency.
- Data Availability: The system relies heavily on third-party APIs (Velon). If the sensors fail or the API is unavailable, the summarization logic breaks.
- Future: Moving forward, the inclusion of on-bike cameras and audio-based shot cropping (e.g., using the commentator's excitement level to trim clips) represents the next frontier for fully autonomous sports production.
In conclusion, the Ghent University team has provided a blueprint for the "Smart TV" era of sports—where the broadcast is not a single video file, but a dynamic, multi-modal database.