
Deciphering the Italian Household: A Multidimensional Data Mining Approach to Public Policy
Data Mining Analysis on Italian Family Preferences and Expenditures
This paper presents a multi-stage data mining framework to analyze the expenditure and service preference patterns of 28,000 Italian families using ISTAT survey data. By integrating Association Rules, Factor/Cluster Analysis, and Canonical Correspondence Analysis (CCA), the authors identify distinct socioeconomic profiles and their drivers.
TL;DR
This research transforms raw ISTAT survey data from 28,000 Italian families into actionable policy insights. By combining traditional statistics with data mining (Association Rules and CCA), the authors demonstrate that while poverty is strictly tied to geography and job stability, the actual usage of services like transport and education is dictated by life-stage (age) rather than wealth.
Background & Motivation
In the private sector, data mining is a tool for profit. In the public sector, however, the goal shifts toward social utility. The Italian National Bureau of Statistics (ISTAT) collects massive datasets, but the complexity of family behaviors often remains "hidden" under the surface of simple averages. The authors argue that to plan public interventions effectively, we must first understand the non-linear relationships between who a family is (demographics) and how they spend their money.
Methodology: The Three-Phase Pipeline
The researchers didn't rely on a single "silver bullet" algorithm. Instead, they built a sophisticated pipeline to handle different data scales (categorical, binary, and continuous).
1. Constructing the Profiles
- Service Profiles: Using Association Rules (A-Priori algorithm), the authors bypassed the computational heaviness of log-linear models. They mapped binary usage (e.g., "does the family use a bus?") into macro-categories like Transport and Instruction.
- Expenditure Profiles: To compare a family of one with a family of five, they applied an Equivalence Scale () to account for economies of scale. They then used Factor Analysis to distill 400 variables into 8 core factors (e.g., "Luxury goods," "Primary goods," "Idle-hours goods").
2. Identifying Social Risk with Decision Trees
The team employed CART (Classification and Regression Trees) to determine which demographic variables most accurately predict a "Poor" expenditure profile.
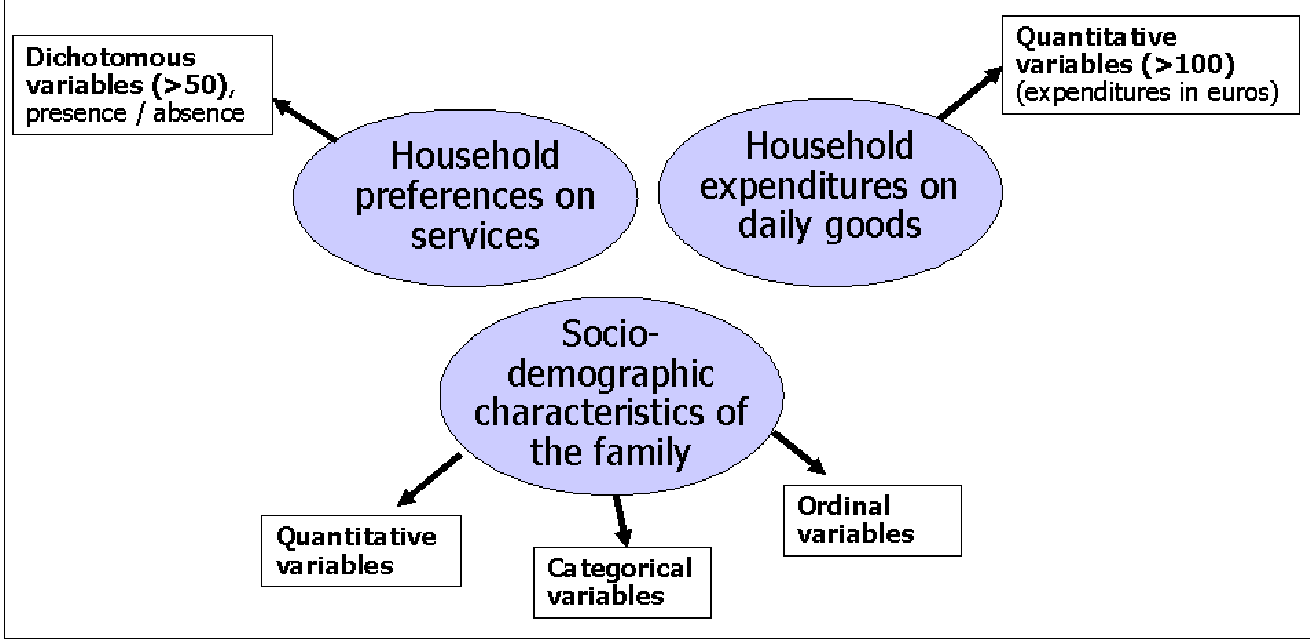 Above: The conceptual classification of variables into Daily Goods, Service Preferences, and Social-Demographic characteristics.
Key Insights & Visual Evidence
The "Richness" Paradox
Using Canonical Correspondence Analysis (CCA), the study mapped service profiles against "Generation" (age) and "Richness" (expenditure).
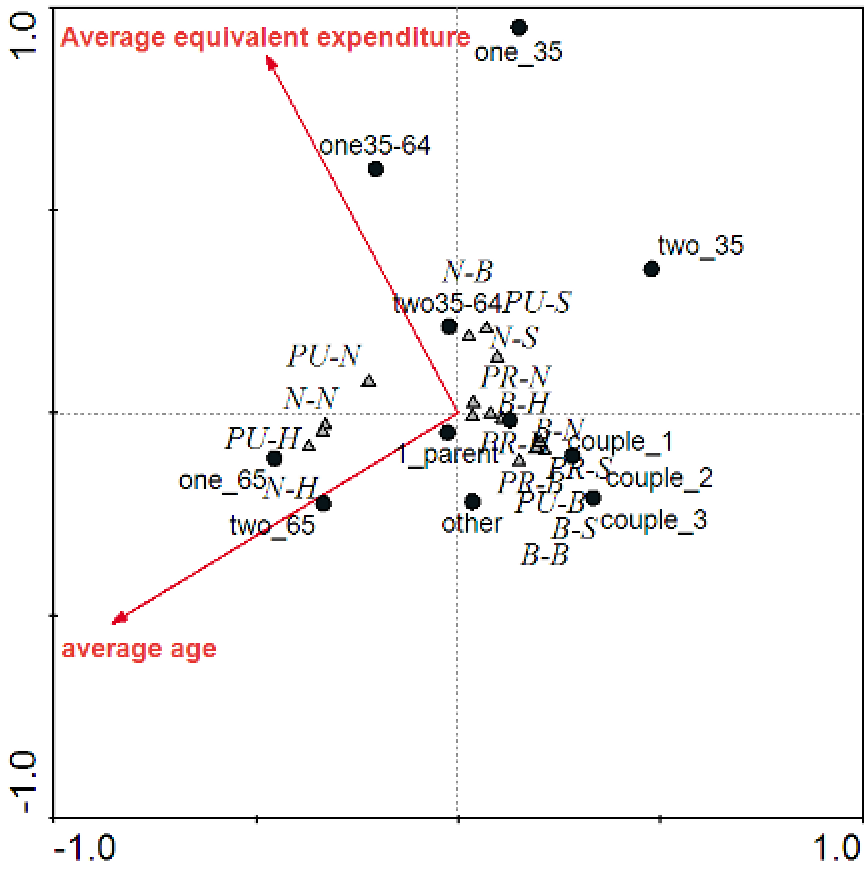 Figure: The CCA map showing that service usage patterns (left-right axis) align closely with the Age vector, while the Richness vector has minimal influence on service choice.
The most striking finding: Economic capability does not dictate service usage. Whether a family uses public transport or invests in education is primarily a function of their age and household structure. Rich or poor, a family with children needs school services; rich or poor, the elderly utilize different transport profiles.
The Profile of Poverty
The Decision Tree analysis (CART) reached 62% accuracy in classification. It highlighted a specific "critical segment" of the population.
| Ranking | Variable | Category Most at Risk |
|---|---|---|
| 1st | Family Type | Single |
| 2nd | Geographical Area | South and Islands |
| 3rd | Professional Position | Precarious Workers |
This data-driven "Portrait of Risk" suggests that Italian social policy should focus heavily on the intersection of geographical location (the South) and job precariousness for single-person households.
Critical Analysis & Conclusion
The value of this paper lies in its methodological synthesis. By using CCA—a technique usually reserved for ecology—on social data, the authors provided a visual proof that "need" is a stronger driver of public service demand than "wealth."
Limitations: The study is based on 2003 data, and the digital divide has shifted significantly since then. Furthermore, the binary "Yes/No" data on services prevents a deeper analysis of the quality or frequency of service usage.
Future Work: The authors suggest integrating geographic GIS data to see if service "preference" is actually restricted by "lack of supply" in certain Italian regions. This would allow the model to distinguish between a family choosing not to use a train and a family unable to use a train because the infrastructure is missing.