
Beyond Points and Lines: A Polygon-Based Framework for Dynamic Geo-Spatial Mining
A data mining framework for environmental and geo-spatial data analysis
The paper introduces a comprehensive data mining framework for geo-spatial and environmental analysis, featuring two novel density-based clustering algorithms: ST-SNN and ST-SEP-SNN. Applied to Houston's ozone pollution data, the framework integrates pre-processing, polygon-based clustering, and change pattern discovery to achieve SOTA performance in identifying dynamic spatio-temporal distribution patterns.
TL;DR
Environment and geo-spatial data analysis has long been hampered by the limitations of point-based clustering. This paper presents a robust framework that transitions the focus to polygons, allowing scientists to track how complex phenomena—like ozone pollution clouds—form, expand, and dissipate. By introducing two new SNN-based algorithms, the authors provide a way to handle high-dimensional spatial data with varying densities.
Context & Motivation: The Geometry of Pollution
Most geo-spatial mining tools treat events as simple coordinates. However, an environmental crisis is rarely a "point." Whether it is an oil spill, a forest fire, or an ozone hot-spot, these events have area, shape, and history.
The authors identify a critical gap in current SOTA methods: they often ignore spatial auto-correlation (the fact that nearby objects are likely similar) and struggle with objects that change their geometry over time. Their mission was to build a framework that treats these "polygons" as dynamic entities across both spatial and temporal dimensions.
Methodology: Re-imagining the Shared Nearest Neighbor (SNN)
The core of the framework lies in moving beyond simple Euclidean distance. The authors propose two approaches to find similarity between polygons:
- ST-SNN: This algorithm fuses spatial and temporal distances into a single weighted metric. It is ideal for finding compact clusters that are strictly similar in both "where" and "when."
- ST-SEP-SNN: This variant keeps spatial and temporal neighbor lists separate, only clustering objects that appear in the intersection of both. This is more flexible for detecting events that might drift over a larger time window but stay localized.
The Analytical Pipeline
As shown in the architecture, the process flows from raw sensor data to a 3D visualization of change patterns:
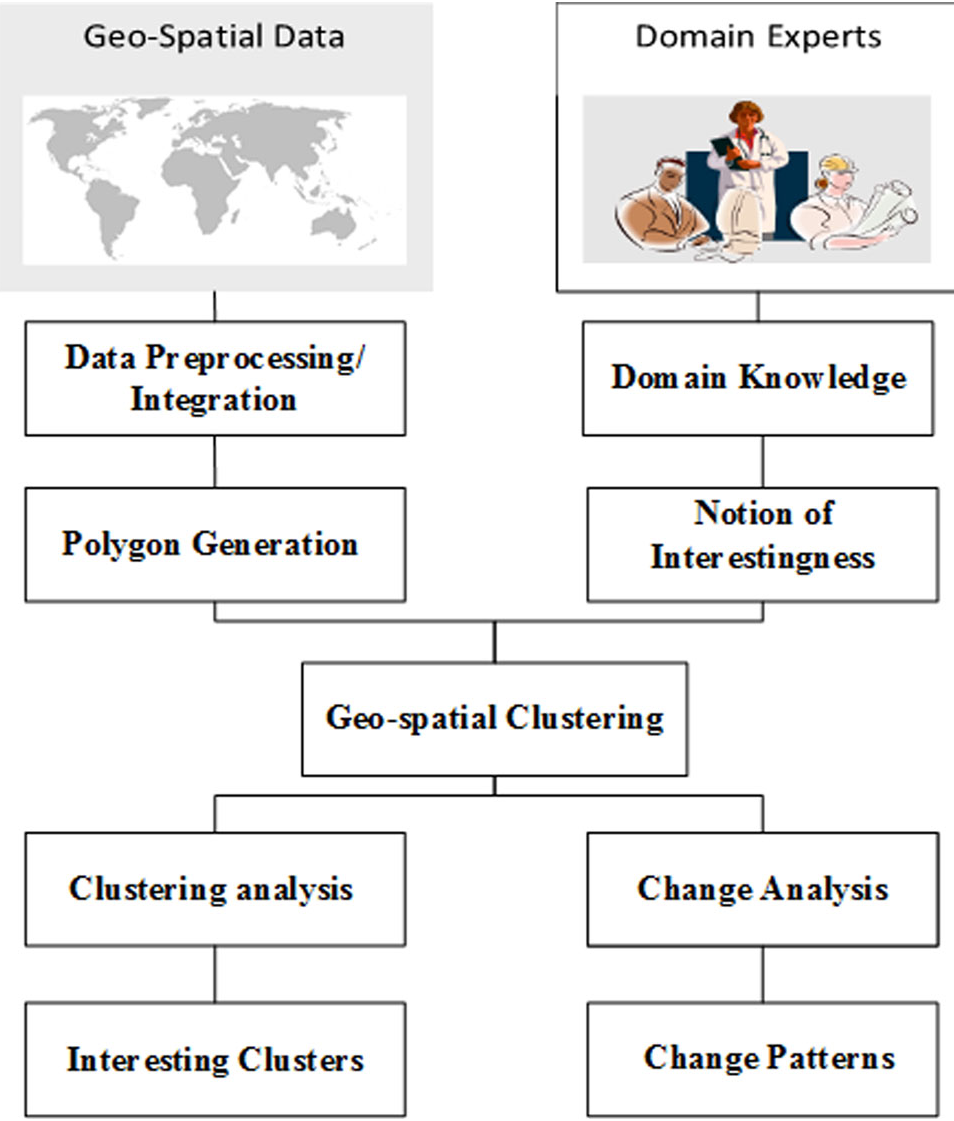
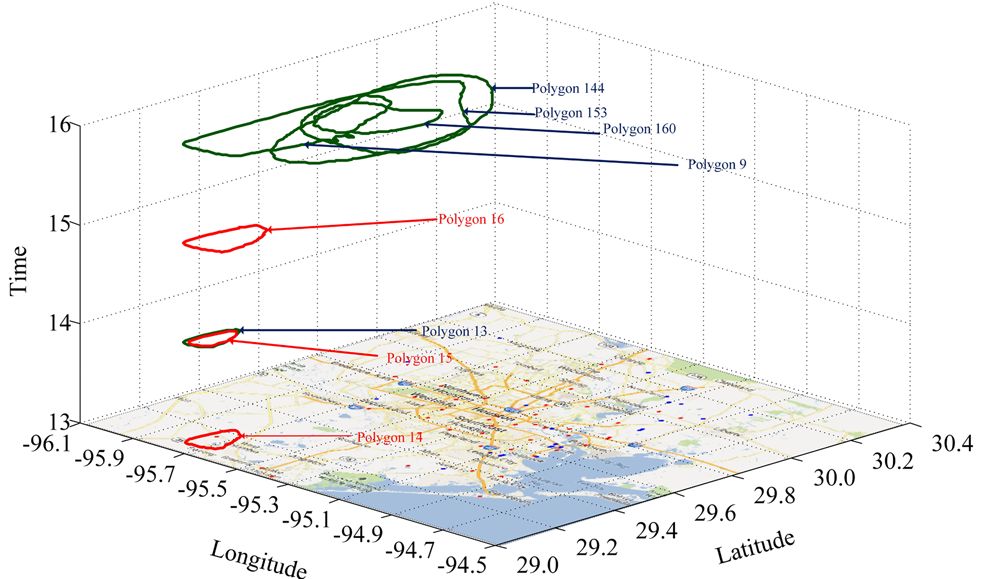
Further, the Poly-CD (Polygon Change Discovery) algorithm introduces a formal grammar for geographic dynamics:
- Formation: A new hot-spot appears.
- Expansion/Dissipation: The area grows or shrinks.
- Disappearance: The threat resolves.
Experiments: Tracking Houston's Air Quality
The researchers applied this to the Houston-Galveston-Brazoria (HGB) area, a region notorious for ozone issues.
Visual Evidence of Cluster Evolution
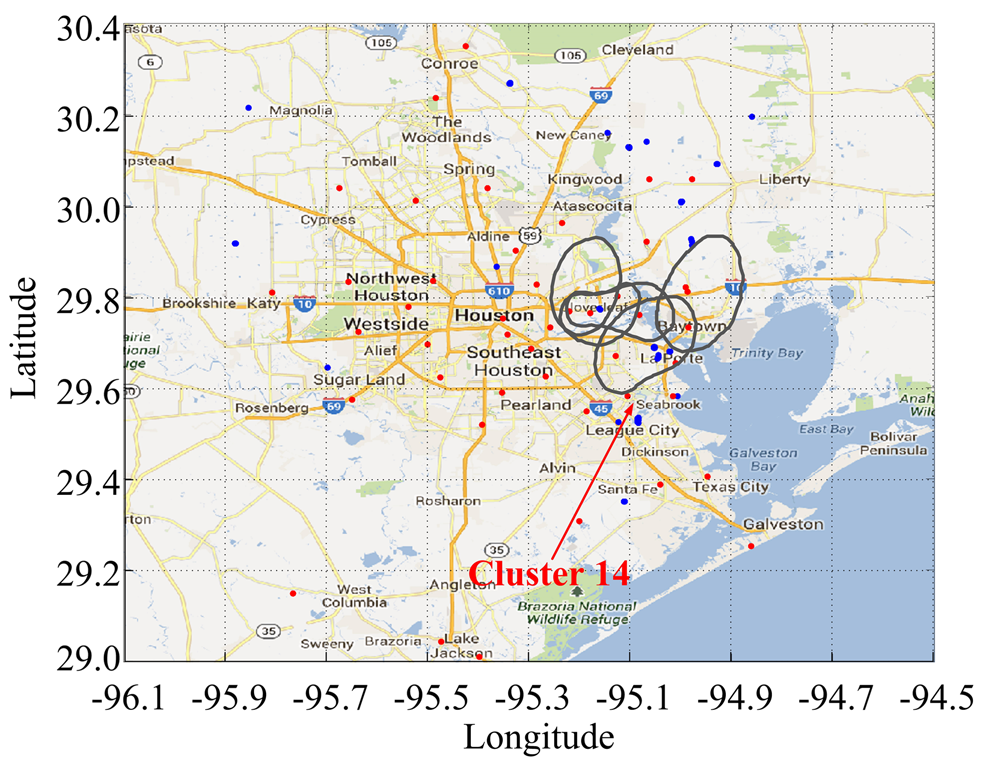
In Figure 6, we see a specific spatio-temporal cluster (Cluster 14) identified along Highway I-10. This wasn't just a random occurrence; the algorithms linked it to high traffic emissions combined with solar radiation peaks between 2:00 pm and 3:00 pm.
Detecting Anomalies
One of the framework's most powerful features is the Post-processing Analysis. By using box plots to calculate the "Degree of Deviation" (R-value), the system can automatically flag clusters that are significantly different from the norm—such as a pollution event occurring in low-wind conditions, which indicates a local industrial leak rather than regional transport.
Critical Insight & Conclusion
While traditional DBSCAN-based methods often struggle with varying densities in high-dimensional space, the SNN approach used here is exceptionally noise-tolerant. The ability to model the "evolution" of a cluster—rather than just its existence—is a significant leap forward for environmental science.
Limitations: The computational complexity remains , though the researchers suggest R*-tree indexing can mitigate this. Future work aims to port this framework to Big Data infrastructures like Hadoop-GIS to handle global-scale sensor networks.
The Takeaway: For modern tech stacks dealing with IoT and environmental sensors, this paper provides the mathematical blueprint for moving from "seeing data" to "understanding events."