
Beyond the Pareto Front: Data Mining the Multidisciplinary Design Space of Regional-Jet Wings
Data Mining for Multidisciplinary Design Space of Regional-Jet Wing
This paper presents a large-scale Multidisciplinary Design Optimization (MDO) of a regional-jet wing using high-fidelity CFD and structural models. It introduces a dual Data Mining framework, combining Self-Organizing Maps (SOM) and functional Analysis of Variance (ANOVA), to extract design knowledge from 130 evaluated solutions across three conflicting objectives: block fuel, maximum takeoff weight, and drag divergence.
TL;DR
In the world of aircraft design, finding the "optimal" solution is only half the battle. This paper explores a real-world regional-jet wing optimization problem where Genetic Algorithms (ARMOGA) were paired with Self-Organizing Maps (SOM) and functional ANOVA. By "mining" the data generated during the search, the authors discovered that the optimizer's preferred "inverted gull-wing" was actually a trap, leading to a modified design that achieved a 3.6% reduction in block fuel.
Problem & Motivation: The "Black Box" of MDO
Modern Multidisciplinary Design Optimization (MDO) is computationally expensive. Running high-fidelity Navier-Stokes (N-S) solvers for aerodynamics and shell-element models for structures takes hours per iteration.
The designers faced three conflicting objectives:
- Minimizing Block Fuel: The ultimate cost metric.
- Minimizing Maximum Takeoff Weight (MTOW): Critical for structural and engine requirements.
- Minimizing Drag Divergence: Ensuring performance doesn't drop off at Maximum Operating Mach numbers (MMO).
The complexity lies in the 35 design variables (PARSEC airfoil parameters, twist, and dihedral). While the optimizer produces a Pareto front, it doesn't tell the engineer why one wing is better than another, or if the optimizer is stuck in a local neighborhood due to mesh constraints.
Methodology: The "Which" and the "How"
The core innovation is the simultaneous use of two Data Mining techniques to "interrogate" the design space:
1. Functional ANOVA (The Quantitative Metric)
Using a Kriging model (a stochastic response surface), the authors decomposed the total variance of the objectives. This tells the designer "which" variables matter most. For example, ANOVA clearly identified that twist at 35% and 55.5% span dominated MTOW and drag divergence.
2. Self-Organizing Maps (The Qualitative Visualizer)
SOM projects 35-dimensional data onto a 2D hexagonal grid. Neighbors on the map are similar in the design space. By coloring these maps with objective values, designers can see the "how"—the physical trends and tradeoffs.
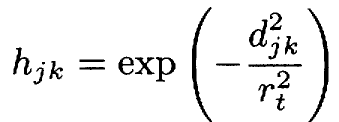 The Batch-SOM algorithm used to cluster high-dimensional design data.
Detailed Insights: Finding the "Sweet Spot"
The SOM analysis revealed a "Sweet Spot" (the lower right corner of the maps) where all three objectives could be relatively low.
One of the most profound findings involved the Gull-Wing geometry. The optimizer initially suggested "inverted gull-wings" (dihedral angles < 180°). However, by mining the SOM (Fig. 5c), the authors noticed that these shapes were correlated with higher structural weights. They realized the optimizer chose them because the unstructured mesh generation process had "distorted" the search space near the leading edge, making traditional "non-gull" wings look artificially worse.
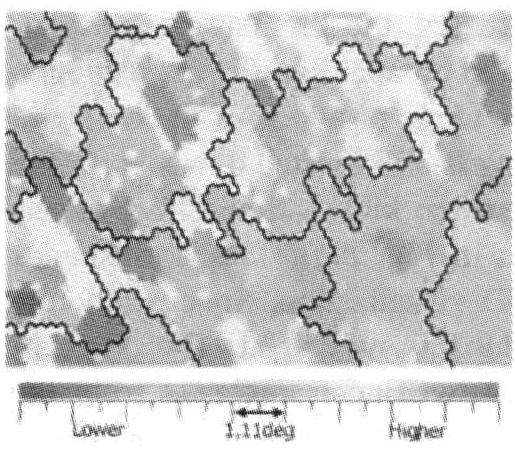 SOM visualizations helping to identify dependencies between wing geometry and performance constraints.
Results: Salvaging Lost Information
By "overruling" the optimizer with the knowledge that non-gull wings should be more efficient if modeled correctly, the authors manually refined the best solution.
The "Optimized-Mod" results were striking:
- Cruise Drag (): Reduced by 10.6 counts.
- Block Fuel: Decreased by 3.6% compared to the initial design.
- Convergence: The study proved that even with few generations (only 130 individuals), Data Mining can extract enough sensitivity information to guide a designer to a superior solution that the algorithm hadn't yet reached.
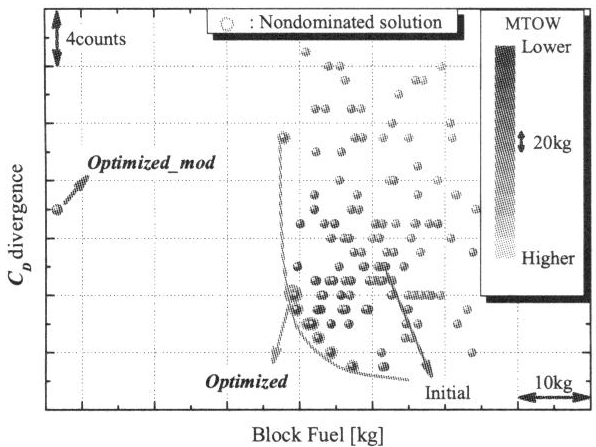 Comparison showing the 'Optimized-Mod' solution significantly outperforming the initial design space exploration.
Critical Analysis & Conclusion
This paper serves as a vital reminder that Optimization Design.
- Value: It proves that SOM and ANOVA are complementary. ANOVA is rigorous but blind to the "shape" of the trend; SOM is intuitive but can be subjective.
- Limitation: The reliance on Kriging for ANOVA means the sensitivity is only as good as the surrogate model. In highly non-linear aerodynamic regimes (like shock wave interactions), the Kriging model might smooth out critical local features.
- Future Impact: This "Knowledge Discovery" workflow is the precursor to modern AI-assisted design, where we don't just ask the AI for an answer, but ask it to explain the manifold of the design space.
Final Takeaway: Truly successful MDO requires a combination of high-fidelity simulation, efficient search, and robust post-process Data Mining to correct for the inherent biases of our computational tools.