
Data-Driven Fields: How Pattern Recognition is Revolutionizing Sustainable Agriculture
Data Mining and Pattern Recognition in Agriculture
This paper explores the integration of Data Mining and Pattern Recognition within "Precision Farming," introducing two novel applications: pre-symptomatic drought stress prediction via Dirichlet-aggregation regression (DAR) on hyper-spectral imagery, and real-time fungal disease classification using smartphone-based texture analysis.
TL;DR
Agriculture is evolving from a labor-intensive tradition into a glass-box data science. This paper highlights how massive datasets from hyper-spectral sensors and smartphones can be transformed into actionable insights. By using Dirichlet-aggregation regression for drought prediction and lightweight texture analysis for smartphone disease tracking, the authors demonstrate that we can detect crop failure before it's even visible to the human eye.
Background: The Intersection of Silicon and Soil
As the global population surges towards 2050, "Precision Farming" is no longer a luxury—it’s a necessity. However, a significant gap exists between high-tech sensing (satellites, robots, hyper-spectral cameras) and actual field utility. Most current AI agricultural tools are either "black boxes" that farmers don't trust or are too computationally heavy for mobile use in areas with poor connectivity.
Problem: The "Big Data" Bottleneck in Phenotyping
The primary challenge is scale. A single hyper-spectral recording can contain billions of matrix entries. Standard techniques like Singular Value Decomposition (SVD) or Non-negative Matrix Factorization (NMF) provide abstract mathematical components that have no immediate biological meaning. Furthermore, supervised learning requires massive amounts of manually labeled data, which is expensive and slow in a biological context.
Methodology I: Predicting the Invisible (Drought Stress)
The authors solve the interpretability problem using Simplex Volume Maximization (SiVM). Instead of abstract factors, SiVM selects actual observed signatures (e.g., a specific healthy pixel or a specific dry pixel) as the basis for the model.
The DAR Framework
- Matrix Factorization: Decompose the massive hyper-spectral matrix into a simplex spanned by "extreme" signatures.
- Dirichlet Aggregation: Model the distribution of these signatures. If a plant has a high probability mass near "dry" prototypes, its stress level is high.
- Gaussian Process Prediction: By treating these distributions as a time series, the Dirichlet-aggregation regression (DAR) can forecast the "drought level" multiple days into the future.
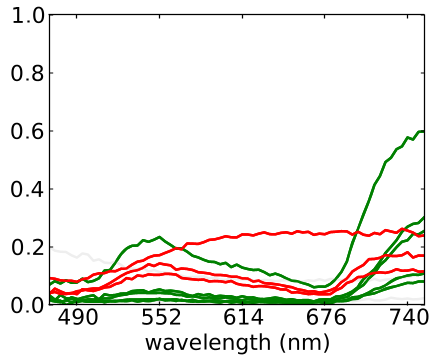 Figure: SiVM selects extreme data points to form a simplex, allowing high-dimensional data to be mapped into an interpretable, lower-dimensional space.
Methodology II: Smartphone-based Disease Diagnosis
For real-world farmers, the goal is identifying fungal pathogens like Cercospora and Phoma using regular smartphone cameras. The challenge here is uncontrolled conditions (varying light, angles, and distances).
The authors designed a "Processing Cascade":
- Max RGB Filtering: Highlights the reddish/brownish hues characteristic of leaf spots.
- LBP on Gradient Magnitudes: Instead of simple color, they look at the texture (Local Binary Patterns) of the gradients. This captures the distinct "edges" and "interiors" of fungus spots regardless of overall lighting.
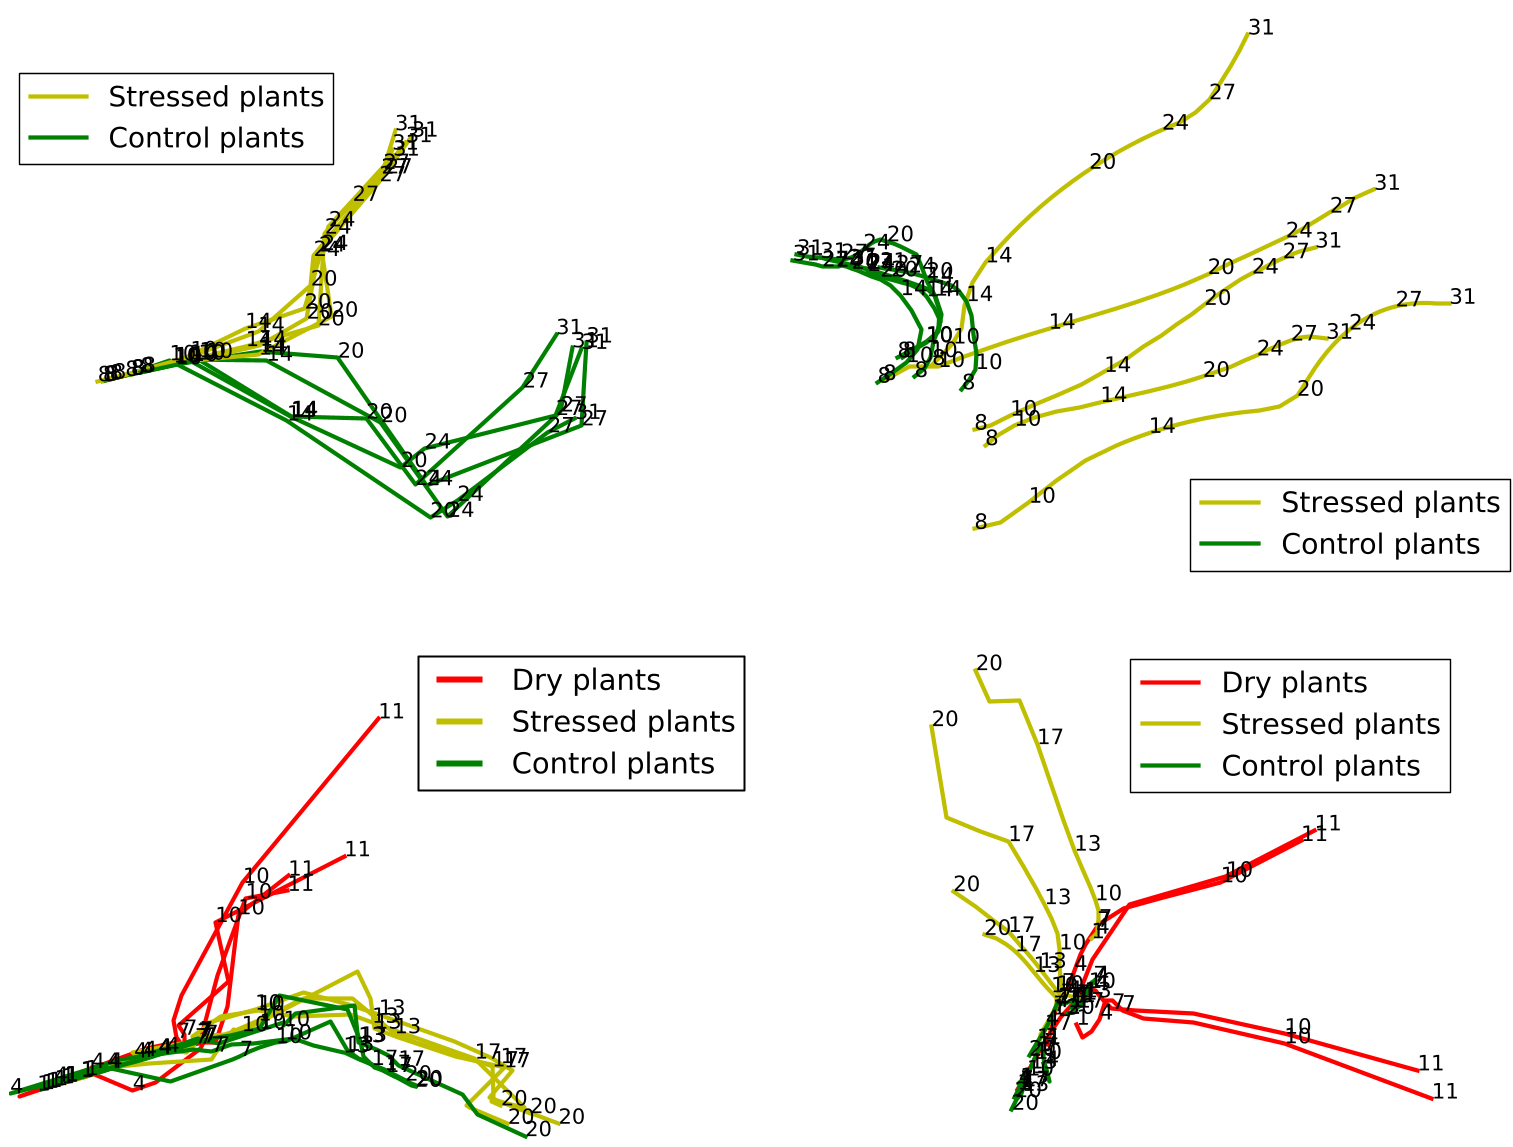 Figure: Visual differences between Cercospora (round, distinct edges) and Phoma (irregular, chlorotic borders).
Experiments & Results
The researchers tested their methods on two main datasets: a multi-year barley drought experiment and a 1,000-image smartphone dataset of sugar beet leaves.
Key Findings:
- Pre-symptomatic Detection: The DAR model successfully distinguished stressed plants from controlled groups well before human experts could see physical wilting.
- High-Speed Accuracy: The smartphone cascade achieved 97% accuracy. Most importantly, it was extremely fast—processing images in mere milliseconds, making it viable for low-power mobile CPU deployment.
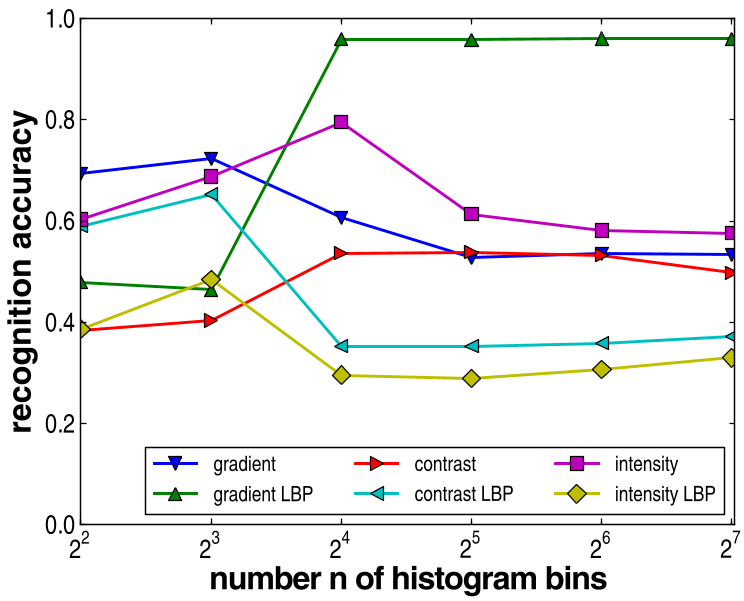 Figure: Accuracy of various texture features. LBPs of gradient magnitudes significantly outperform standard intensity-based entropy.
Critical Insight: The Future is Interpretable
This work highlights a shift in Agricultural AI. The value doesn't just come from high accuracy, but from Data-Intensive Discovery—using models that biologists can interpret. By using actual observed signatures as basis vectors, the AI explains "why" it thinks a plant is stressed (e.g., "The spectral signature is shifting toward the prototype for overheating").
Limitations and Outlook
While the results are promising, the study notes that agricultural environments are inherently uncertain. Future work needs to scale these "near-range" findings to "wide-area" drone or satellite imagery. Furthermore, the reliance on a central server for the smartphone app suggests a need for even more edge-computing capability to handle rural areas with zero bandwidth.
Takeaway: The marriage of Bayesian regression and lightweight computer vision is the key to managing the world's food production in a changing climate.