
Deciphering Regional Emissions: The Crucial Role of Data Pre-processing in the ClairCity Project
Data Pre-processing Techniques in the Regional Emission's Load Profiles Case
This paper presents a comprehensive case study on data pre-processing techniques—cleaning, transformation, integration, and reduction—specifically for modeling regional emission load profiles within the ClairCity project. By applying these methods to datasets from Sosnowiec, Poland, the authors demonstrate how to convert raw, noisy environmental and energy data into structured inputs for air pollution modeling.
TL;DR
Modeling urban air pollution is as much a data engineering challenge as it is a climate science one. This paper details the "unavoidable" pre-processing pipeline—encompassing cleaning, transformation, and reduction—required to turn raw energy and weather data into a functional emission load profile for the city of Sosnowiec, Poland. By systematically addressing noise and inconsistency, the researchers transformed 365 fragmented daily reports into a unified, high-resolution hourly model.
Background Positioning
In the landscape of environmental science, this work sits at the intersection of Data Mining and Urban Policy. It isn't a "new algorithm" paper; rather, it is a methodological blueprint for practitioners. It validates the industry heuristic that data preparation dominates the project lifecycle, providing a rigorous benchmark for the ClairCity initiative.
Problem & Motivation: The "Dirty Data" Hurdle
Why is regional emission modeling so difficult? The authors identify several structural pain points:
- Heterogeneous Sources: Data comes from commercial weather services (temperature), Eurostat (gas), and open power platforms (electricity), each with unique formats (.csv, .tsv, .txt).
- Dimensionality Curse: Raw datasets often contain dozens of variables (e.g., 29 in temperature files) when only two are needed for the physics of the model.
- Temporal Fragmentation: Data might be stored in hundreds of individual files, making longitudinal analysis impossible without heavy integration.
The core insight of the authors is that "understanding the nature of the data collection" is the only way to achieve pre-processing efficiency. Without a structured pipeline, the modeling phase is destined for "garbage in, garbage out."
Methodology: The Pre-processing Engine
The authors adopt a four-pillared strategy:
- Cleaning: Using Lagrange interpolation to fill gaps in energy records.
- Transformation: Aggregating raw units into percentage-based shares to allow for sector-wide comparisons.
- Integration: Employing command-line tools to merge 365 separate CSV files into a continuous 8,760-hour annual dataset.
- Reduction/Selection: Pruning non-essential metadata (like UTC timestamps when CET is preferred) to enhance computational efficiency.
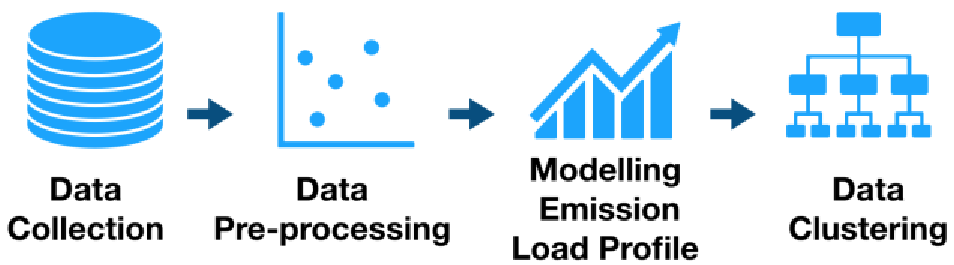
Overall Framework
The transition from raw data collection to the final clustering phase follows a linear, rigorous hierarchy:
Experiments & Results: Case Study Sosnowiec
The researchers applied their pipeline to the city of Sosnowiec, Poland (2015).
1. Temperature Integration
By reducing the variable count from 29 to 2 (datetime and temp) and performing interpolation, the team created a robust hourly resolution profile. This is critical because temperature is the primary driver of domestic heating energy consumption.
2. Gas & Electricity Modeling
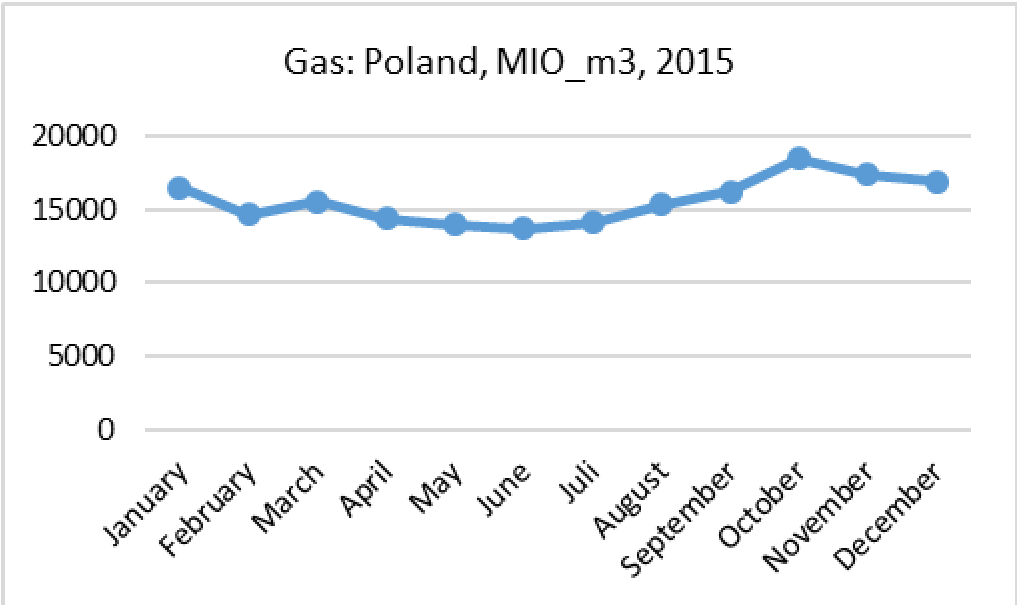
The transformation of Eurostat's monthly gas data into a "monthly share percentage" allowed the researchers to visualize seasonal patterns.
3. Sectoral Emission Analysis
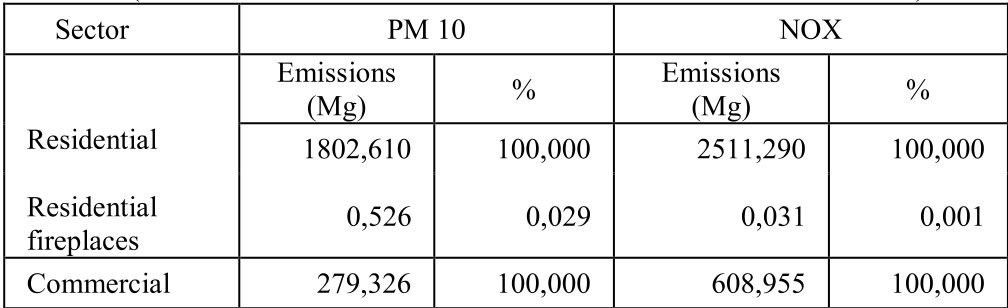
The analysis of PM10 and NOX pollutants revealed the specific impact of residential sectors versus commercial sectors, as summarized in the final processed dataset:
Critical Analysis & Conclusion
The Takeaway: Data pre-processing is not a "one-size-fits-all" task. The authors correctly point out that while spreadsheets suffice for moderate tasks, programming (Python) is mandatory for complex big data structures.
Limitations: The study relies heavily on interpolation for missing values. While mathematically sound, if the "gaps" in the data coincide with extreme weather events, the linear nature of interpolation might smooth out critical peaks in the emission profile.
Future Outlook: The next frontier is Spatial Emission Loading. Transitioning from temporal trends (when emissions happen) to spatial allocation (where they happen at a street level) will require an even more complex integration of GIS (Geographic Information Systems) data, presenting a new set of pre-processing challenges.