
Deciphering Digital Shadows: Automated Forensics and Visualization in Social Networks
Data Visualization for Social Network Forensics
The paper presents a novel framework for social network forensics that enables the automated extraction and visualization of user data from platforms like Facebook without requiring operator cooperation. By leveraging APIs and web-based data sources, the authors generate Social Interconnection and Interaction Graphs to map relationships and communication patterns for forensic investigations.
TL;DR
Social network forensics has long been at the mercy of platform operators and manual data requests. This paper, "Data Visualization for Social Network Forensics," introduces a paradigm shift: a method to extract, reconstruct, and visualize social data—such as friend clusters and interaction patterns—automatically and without operator assistance. By transforming raw API data into intuitive graphs, it allows investigators to identify key communication partners and event timelines in minutes.
Background: The Forensic Deadlock
In the "classic" era of forensics, investigators grabbed hard drives and hashed files. In the age of Facebook and cloud computing, that model is broken. Data is distributed across global data centers, and "passive" logging (sniffing traffic) is defeated by modern HTTPS encryption.
Currently, investigators face a Dual Bottleneck:
- Operator Dependency: Waiting for subpoenas and receiving potentially incomplete "law enforcement packets."
- Data Obfuscation: Even with data in hand, visualizing a social graph of 800+ million users to find a specific criminal link is like finding a needle in a global haystack.
Methodology: Mining the Social API
The authors' core insight is that social network APIs—designed for app developers—can be weaponized for forensics. They bypass the need for physical server access by treating the social network as a dynamic "Data Pool."
1. The Social Interconnection Graph
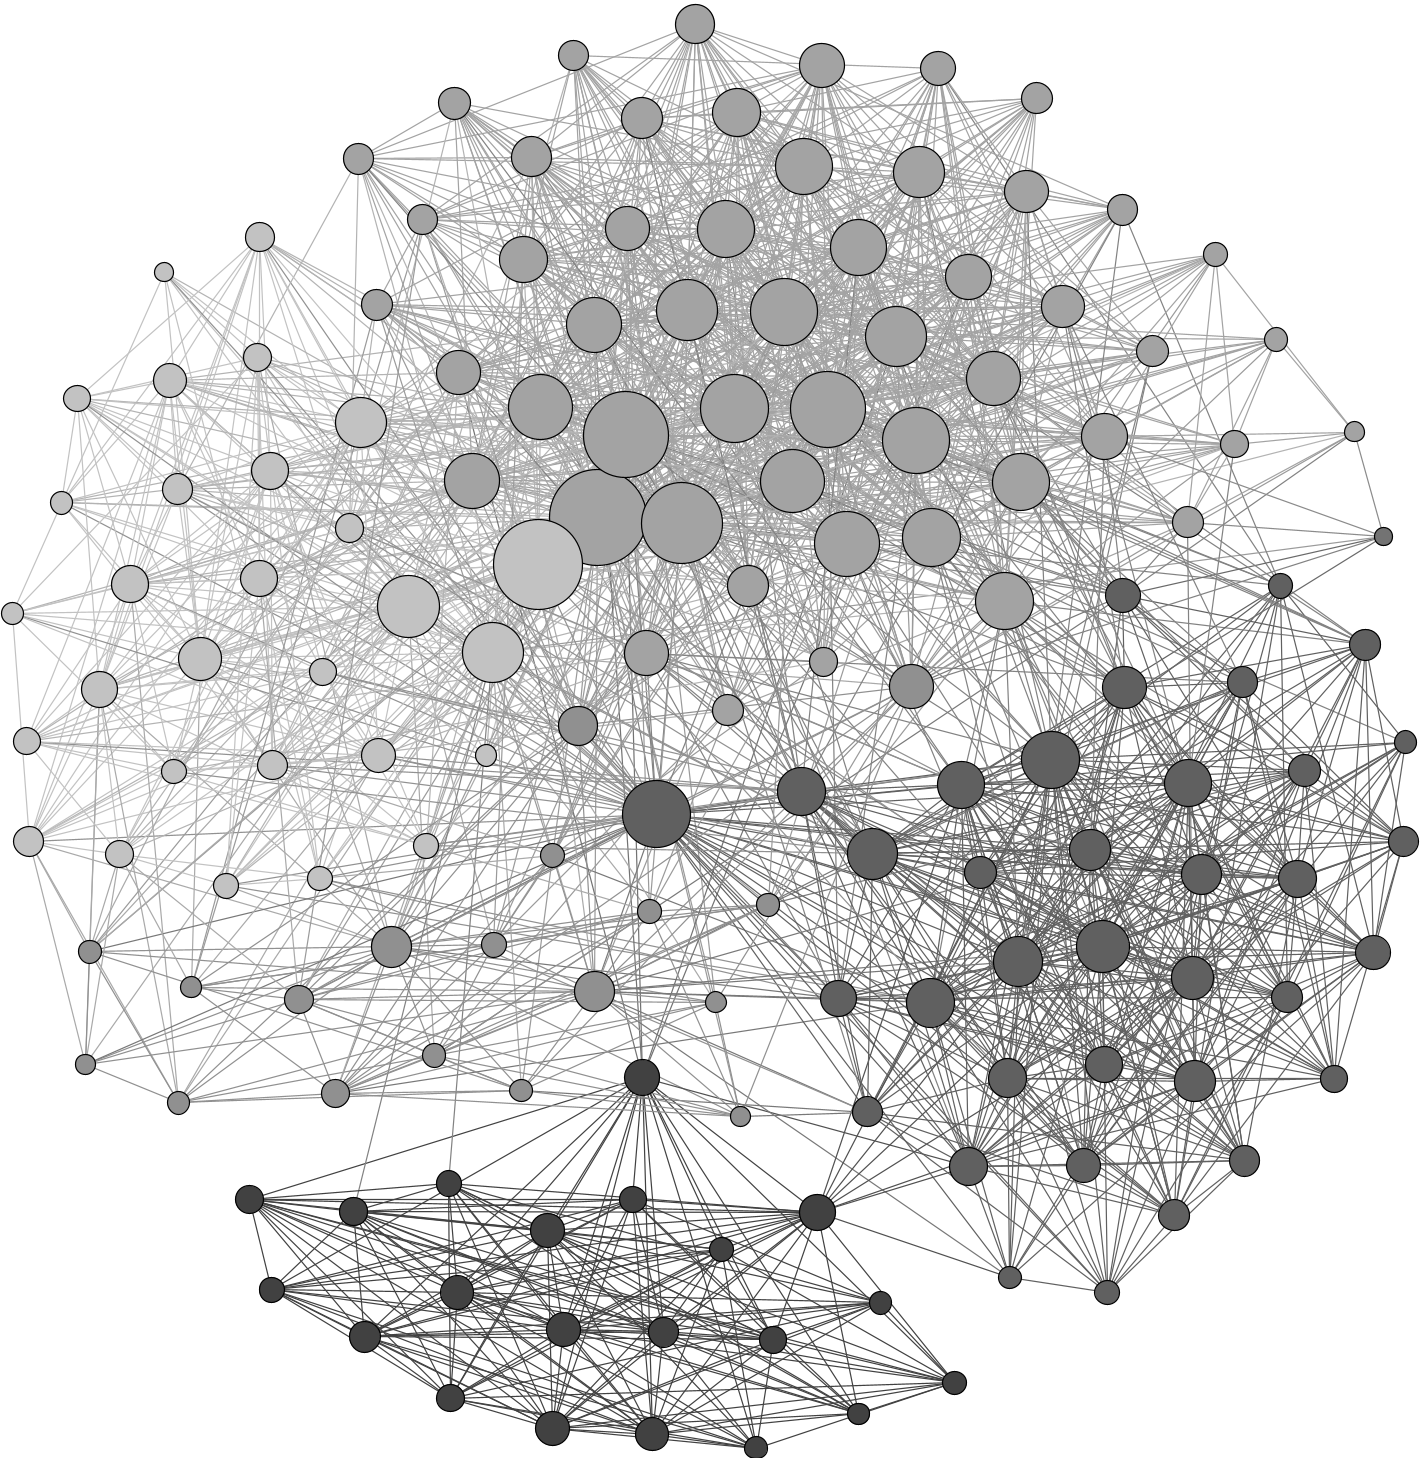
Instead of just listing friends, the method queries the API to see if Friend A knows Friend B.
- The Math: An undirected graph where are friends and represents mutual connections.
- The Insight: By applying the Fruchterman-Reingold algorithm, the software automatically clusters these nodes. In a forensic context, this reveals distinct "life spheres"—e.g., a workplace cluster vs. a crime-related group.
2. The Social Interaction Graph (Directed and Weighted)
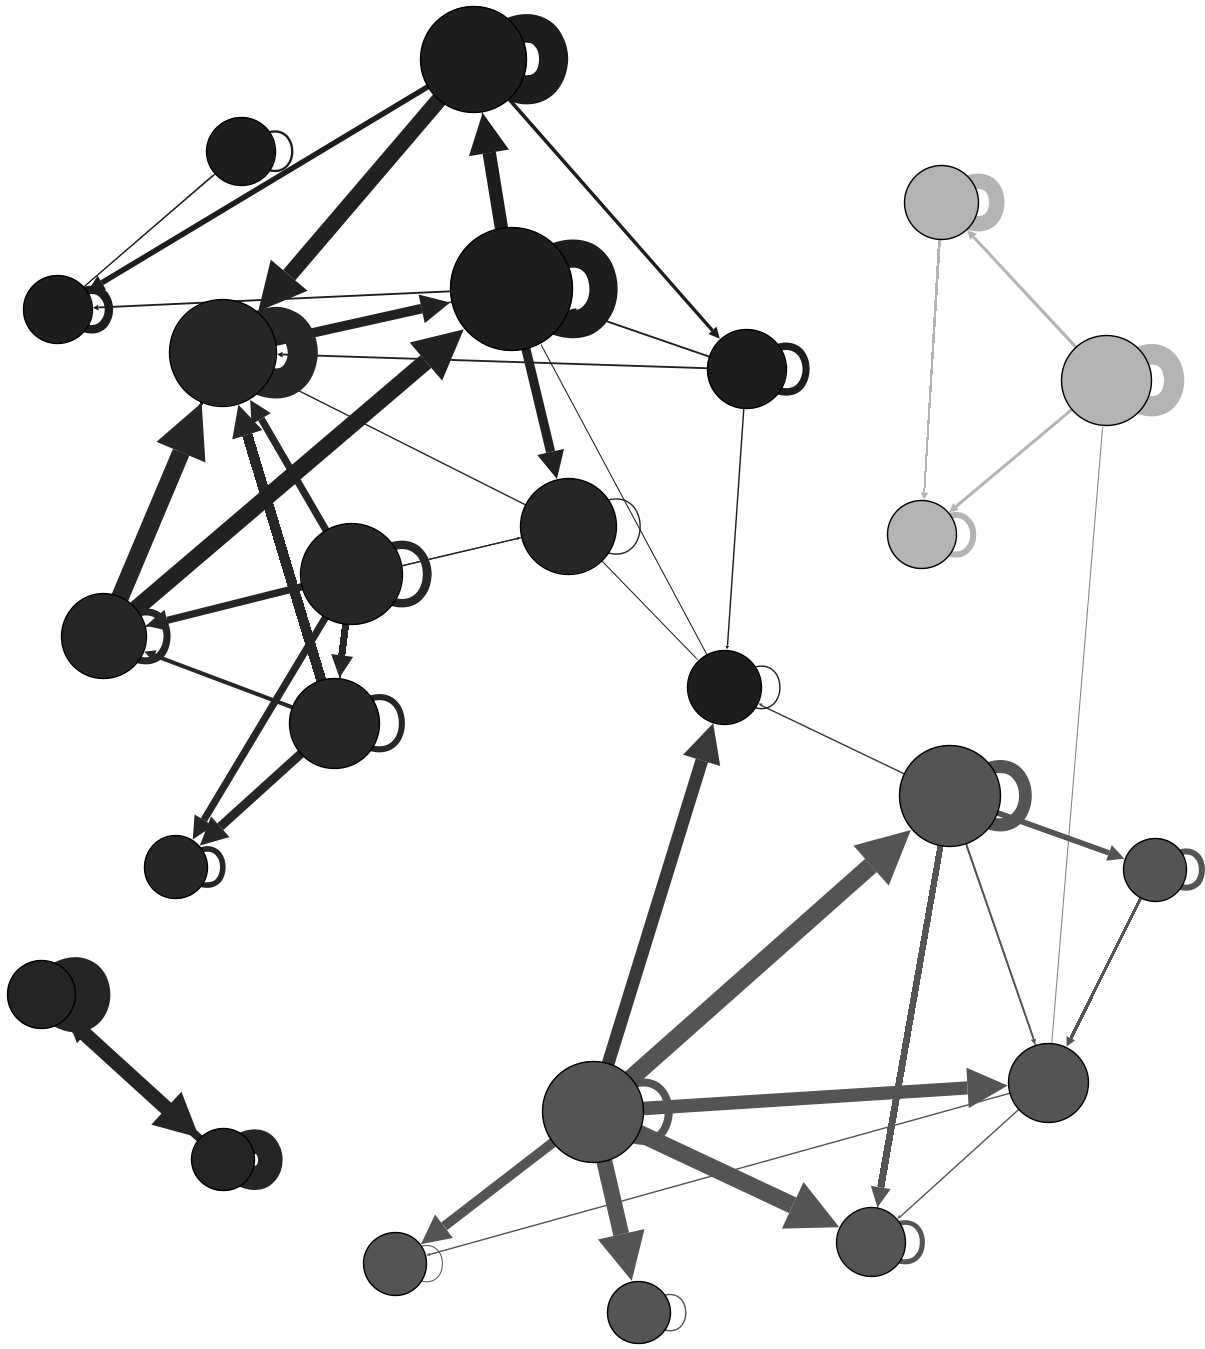
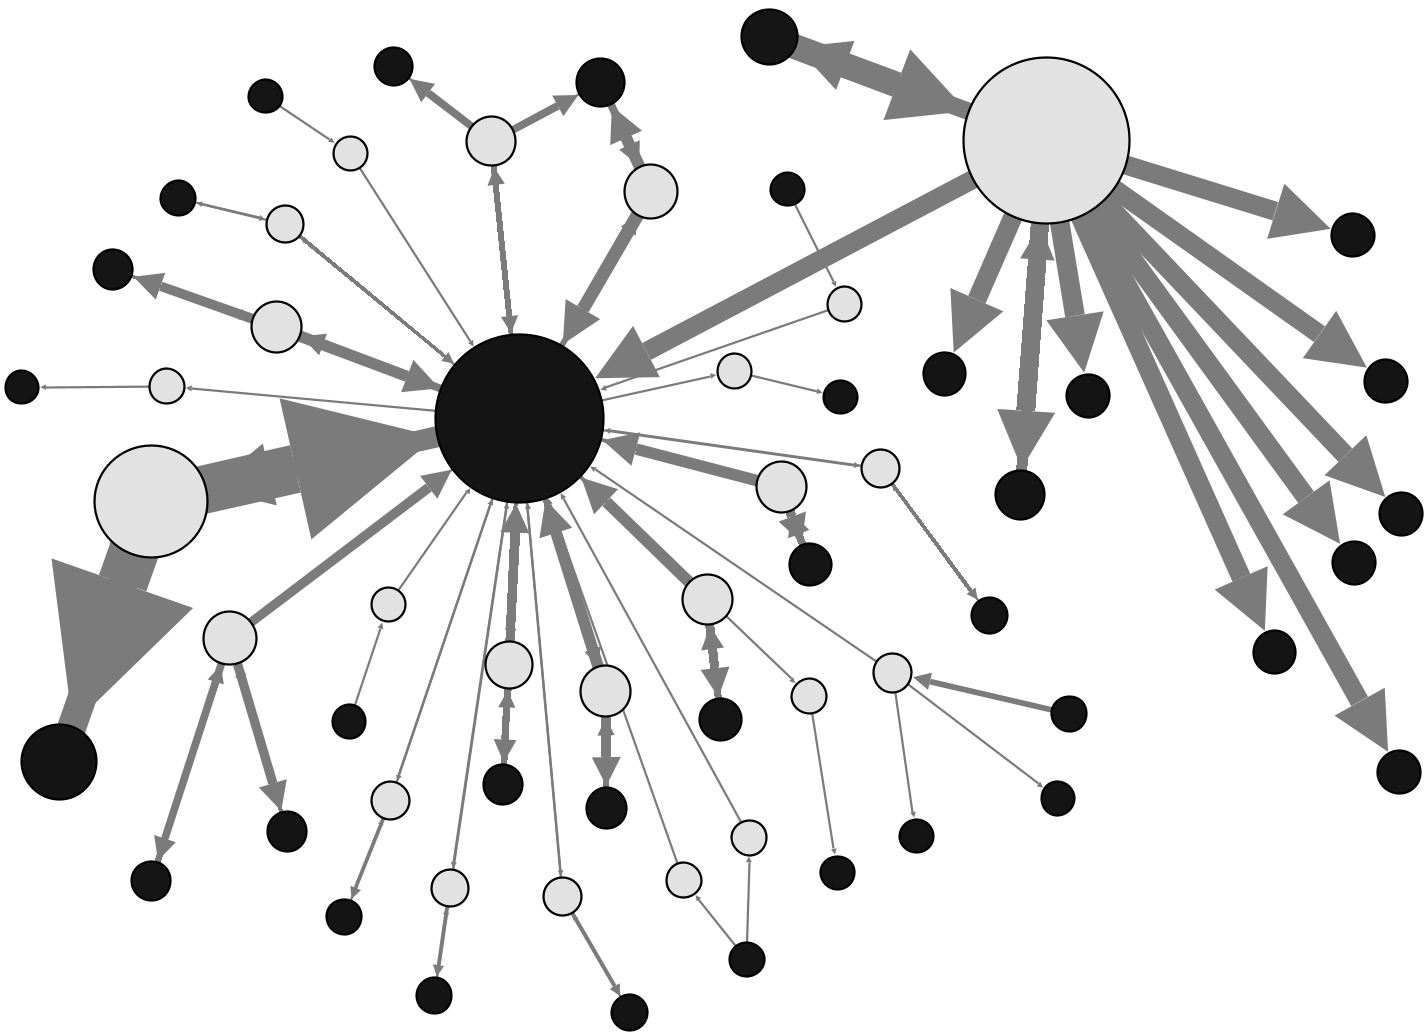
Who a person is "friends" with matters less than who they actually talk to. The authors generate interaction graphs by parsing:
- Wall Posts & Messages: Counting frequencies.
- Picture Tags: An edge is drawn from the uploader to the tagged friend. This indicates a high level of "real-world" physical proximity or trust.
Experimental Results: Rapid Reconstruction
The authors tested their methodology on real-world Facebook accounts. The results were telling:
- Efficiency: A comprehensive data acquisition (social connections, pictures, communications) took just 20 minutes.
- Clarity: The automated tool produced color-coded clusters (Figure 1), allowing non-technical investigators to immediately see social outliers.
- Event Tracking: By matching timestamps across a cluster of friends, the system creates a "Common Timeline," which is vital for verifying alibis or tracking the spread of malicious links.
Critical Analysis: A Moving Target
While the paper presents a powerful "snapshot" capability, it acknowledges a significant challenge: Ephemeral Data.
- Lack of Reproducibility: Because social networks are dynamic, a profile captured at 2:00 PM might look different by 2:05 PM if the user deletes a post.
- Completeness: Data deleted before the forensic capture is likely lost forever unless retrieved from the operator's internal backups.
Conclusion and Future Outlook
This work proves that "Operator Non-Repudiation" is a myth in social forensics; investigators can—and should—independently verify social data. Moving forward, the value of this research lies in Differential Snapshots: the ability to track how a suspect’s social circle changes over time, potentially revealing the precise moment they began "pruning" their digital footprint to evade detection.
As social networks transition toward more private, encrypted spaces, the visualization techniques proposed here will remain the gold standard for turning chaotic social noise into actionable forensic intelligence.