
Visualizing the Invisible: A Framework for Emotion Regulation in AI-Driven Learning
Using data visualizations to foster emotion regulation during self-regulated learning with advanced learning technologies: a conceptual framework
This paper introduces a theoretically grounded conceptual framework for using data visualizations to foster Emotion Regulation (ER) during Self-Regulated Learning (SRL) with Advanced Learning Technologies (ALTs). It leverages multimodal, multichannel data—including eye-tracking, facial expressions, and physiological sensors—to provide learners with real-time visual feedback on their own cognitive, affective, metacognitive, and motivational (CAMM) processes.
TL;DR
While most educational technologies focus on what you learn, this paper argues they should focus on how you feel while learning. The authors propose a conceptual framework that uses complex data visualizations (like eye-tracking heat maps) to help students monitor and regulate their emotions. By turning hidden biological signals into actionable visual feedback, Advanced Learning Technologies (ALTs) can prevent frustration from turning into total disengagement.
The "Affective Gap" in Self-Regulated Learning
Most modern learning dashboards are "Open Learner Models"—they show you which math problems you got wrong or how many chapters you've read. However, they are "emotionally blind." In the high-stakes environment of STEM learning, a student might move from confusion (which can be productive) to frustration, and finally to boredom or "rage-quitting."
The problem is twofold:
- Hidden States: Learners are often unaware of their own deteriorating emotional state until it's too late.
- Cognitive Overload: Raw data from skin conductance sensors or eye-trackers is too abstract for a student to understand in the heat of a difficult task.
The authors' insight is that we need a "theoretical bridge" between raw multichannel data and the psychological process of Emotion Regulation (ER).
Methodology: The ER-SRL Framework
The framework is built on James Gross’s Process Model of Emotion Regulation, adapted for the digital classroom. It identifies four intervention points where visualizations can help:
- Attentional Deployment: Using gaze data to show a student they are "stuck" fixating on irrelevant information.
- Situation Modification: Prompting a learner to change their goal or take a break based on high physiological arousal.
- Cognitive Change: Helping a learner reappraise a "racing heart" not as anxiety, but as "readiness to learn."
- Response Modulation: Encouraging specific behaviors (like a breathing exercise) when the system detects prolonged negative facial expressions.
The Multichannel Data Matrix
The paper categorizes the "fuel" for these visualizations:
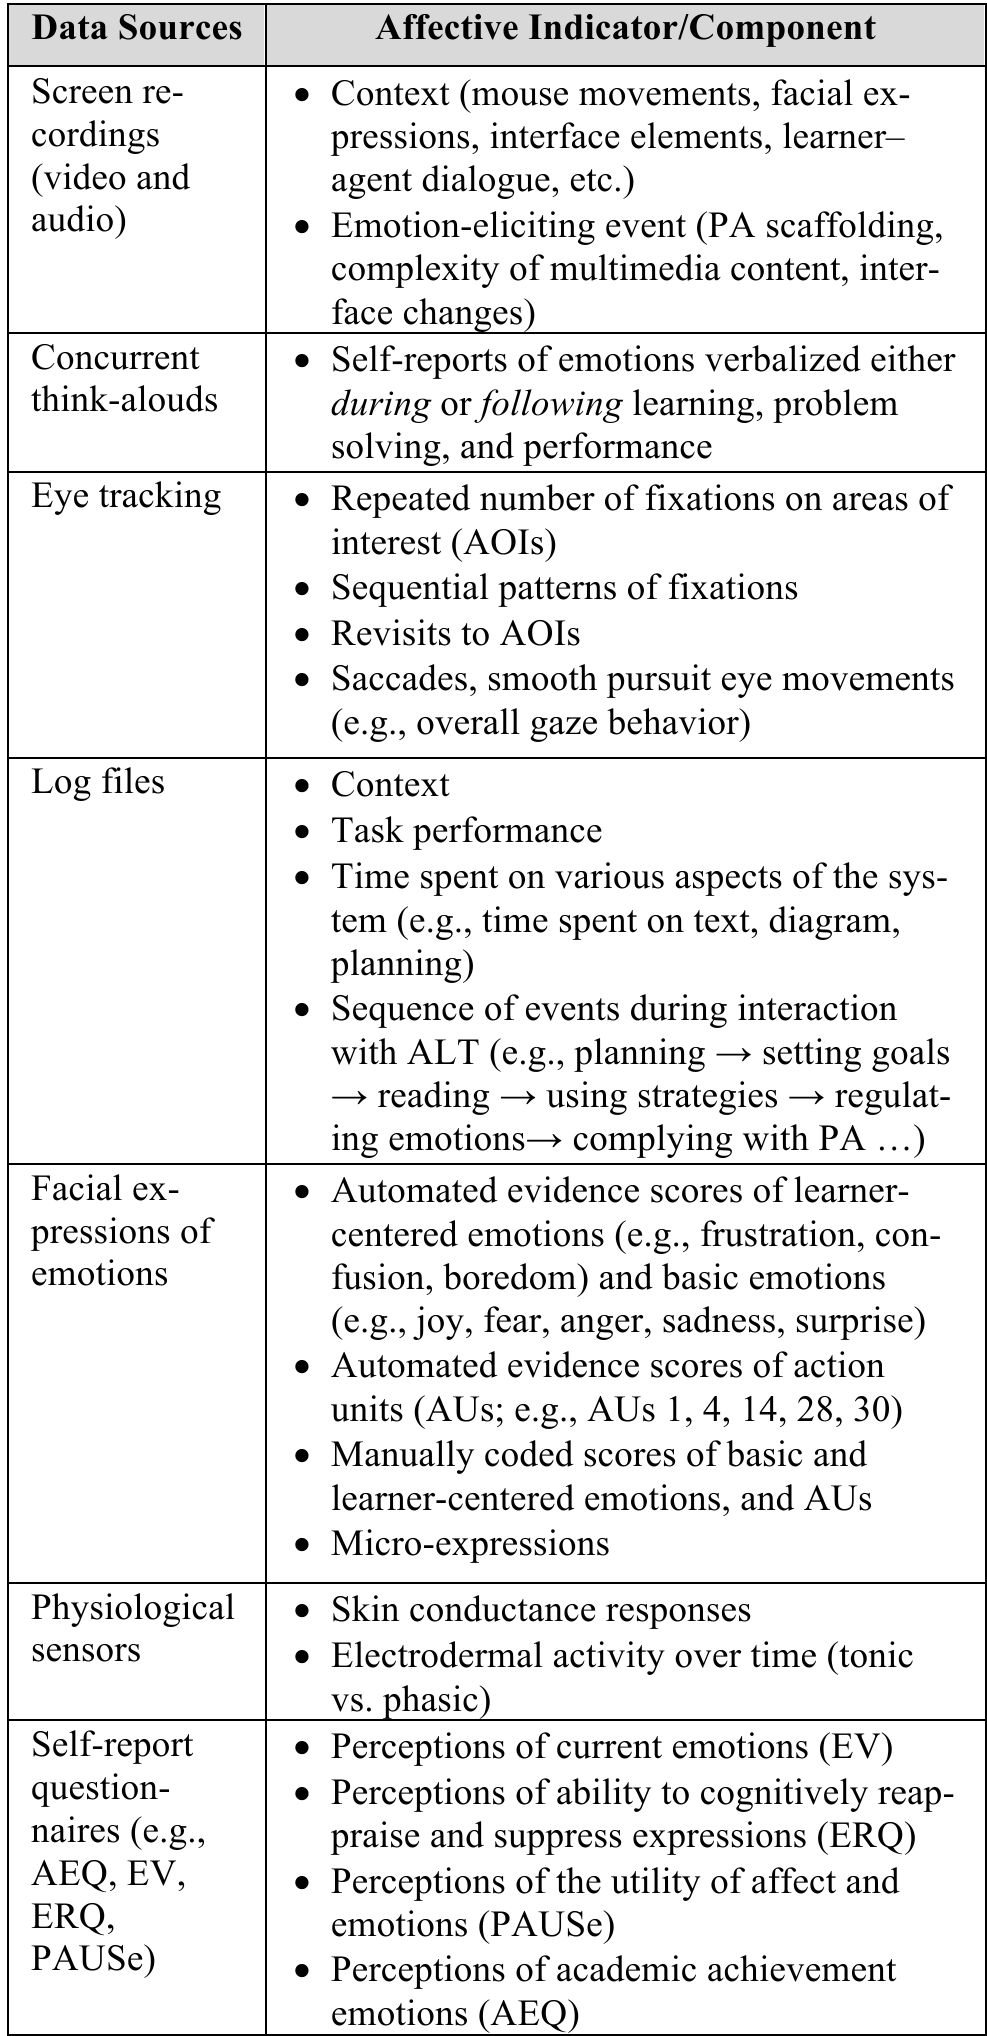
- Eye Tracking: Reveals fixations and saccades (where you look/what you ignore).
- Facial Expressions: Automated detection of frustration, joy, or boredom.
- Physiological Sensors: Measuring Electrodermal Activity (EDA) to track stress/arousal levels.
Architecture of an Emotional Intervention
To make these abstract signals useful, the authors propose "Complex Visualizations of CAMM (Cognitive, Affective, Metacognitive, Motivational) Data."
In the example provided, the system doesn't just show a heat map; it uses a Pedagogical Agent (PA) to perform a "cognitive walkthrough." The agent points out that the student is frustrated because their attention (captured by eye-tracking) is fragmented and they are failing to coordinate the text with the diagrams.
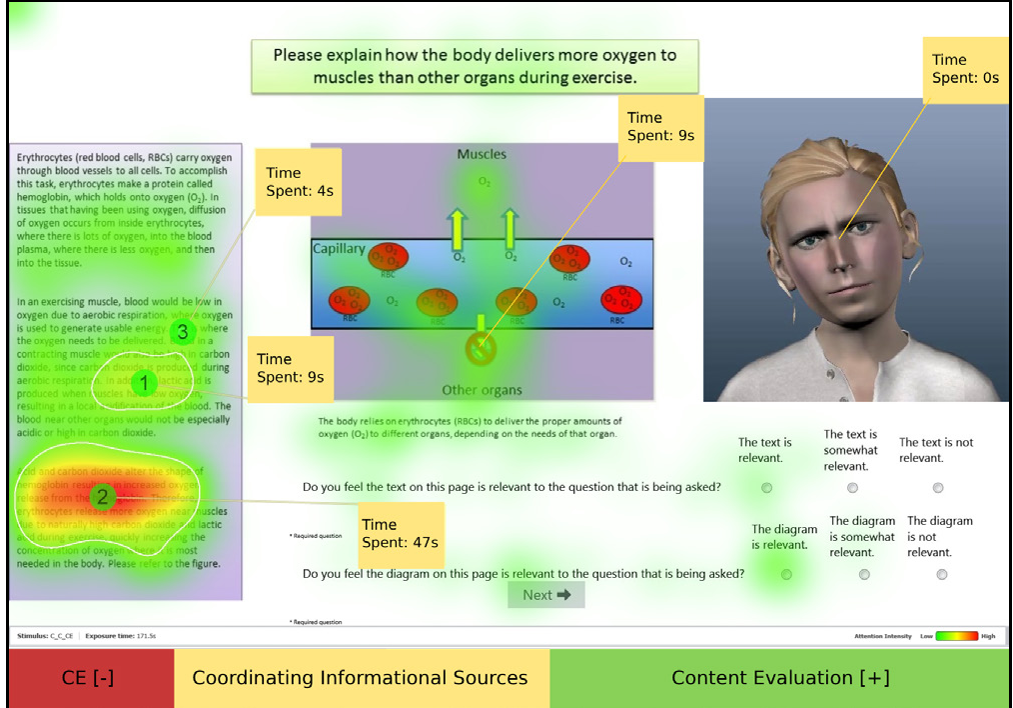 Figure 1: This visualization integrates gaze behavior (heat map) with metacognitive accuracy bars, allowing the learner to see the synergy between their attention and their performance.
Critical Insight & SOTA Advancement
The true value of this work lies in its move toward Emotion Efficacy. Previous SOTA (State of the Art) systems treated emotions as something the system should react to (e.g., the computer gets easier if the student is sad). Azevedo et al. argue for agency: the system should give the data to the student so they can learn to regulate themselves. This shifts the focus from "Reactive AI" to "Empowering AI."
Conclusion & Future Outlook
This framework sets the stage for a new generation of "Emotion-Aware Dashboards." However, significant hurdles remain:
- Cognitive Load: How do we show this data without distracting the learner?
- Individual Differences: Does a "frustrated" facial expression mean the same thing for every culture or personality type?
As we move toward personalizing education with Big Data and AI, "affective scaffolding" will be the difference between a tool that merely teaches facts and one that builds resilient, self-aware learners.