
SoMDA: Democratizing Social Media Insights through Automated Microservices
Towards Democratizing Social Media Data Analysis and Visualization Using SoMDA
The paper presents SoMDA (Social Media Data Analysis), an automated platform designed to simplify the extraction, analysis, and visualization of social media data. By integrating distributed storage (Couchbase) and dynamic R-based visualization (Shiny), the system aims to SOTA-level accessibility for non-technical researchers.
TL;DR
Analyzing social media at scale usually requires a team of developers and data scientists. SoMDA (Social Media Data Analysis) changes this by providing a free, automated platform that handles everything from API extraction to Sentiment Analysis and dynamic visualization, allowing researchers in politics, culture, and economics to gain insights without writing a single line of code.
The "Technical Wall" in Social Analytics
In the modern digital landscape, social media is a goldmine for understanding human behavior. However, the barrier to entry is high. Traditional workflows require:
- Programming: Knowledge of Python or R.
- Infrastructure: Setting up servers and NoSQL databases to handle high-velocity data.
- Specialized APIs: Navigating the complex rate limits and authentication of Twitter, Facebook, and YouTube APIs.
Prior works like NodeXL or Twitinfo either focus solely on Twitter or come with hefty price tags that stifle academic and independent research. SoMDA was born from the need to break these barriers.
Methodology: The Architecture of Accessibility
The authors designed SoMDA around a Microservices Architecture, ensuring that data collection, storage, and visualization are decoupled yet seamlessly integrated.
1. The ETL Pipeline
SoMDA employs a refined Extract, Transform, Load (ETL) process:
- Extraction: Users input keywords via a web dashboard; the system communicates with social APIs in the background.
- Analysis: Using
TextBlob, the system performs Natural Language Processing (NLP) to classify sentiment (Positive/Neutral/Negative) and subjectivity. - Storage: Instead of traditional relational databases that struggle with scale, SoMDA uses a Couchbase NoSQL cluster, allowing for high-speed JSON document storage.
2. The Visualization Engine
By leveraging R Shiny Server and ggplot2, the platform converts raw JSON data into interactive, dynamic charts including:
- Sentiment Time Series: Tracking shifts in public mood over time.
- Wordclouds: Identifying the most recurrent terms and brand mentions.
- Geographic & Language Distributions: Mapping the reach of specific topics.
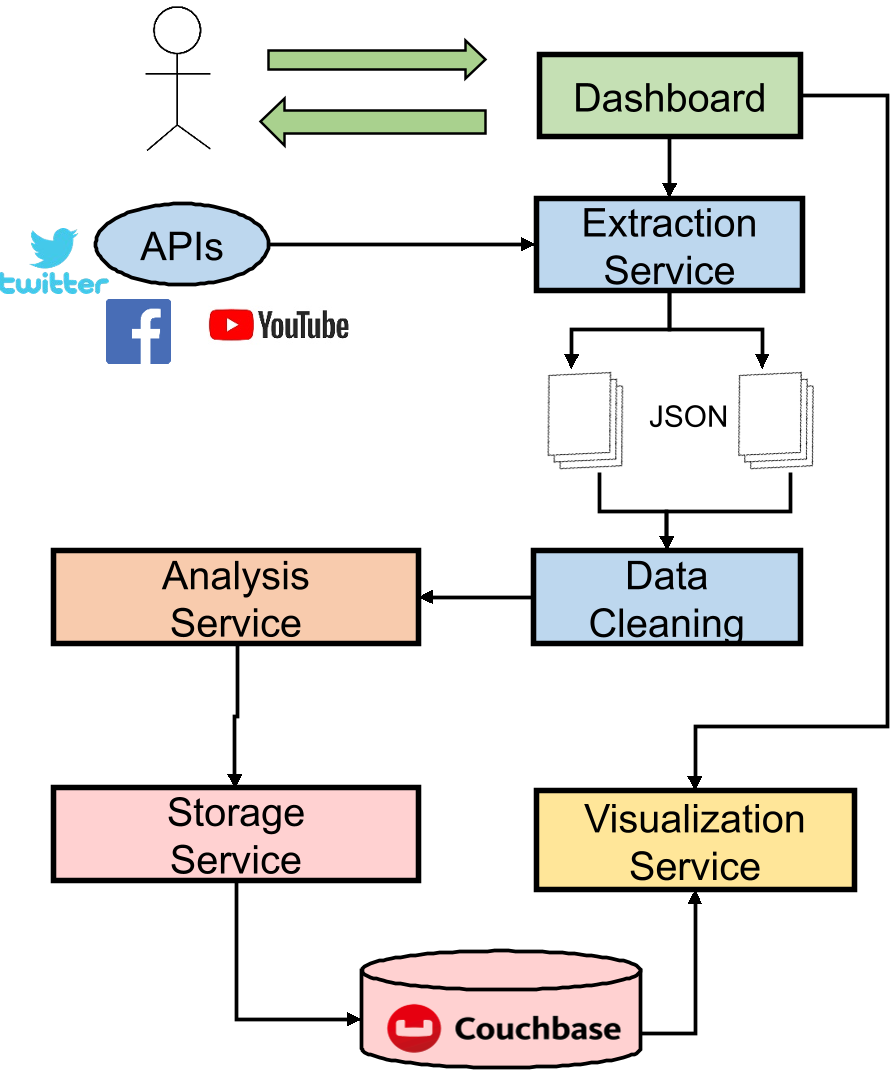 Figure 1: The microservice-based interaction flow between the Dashboard, Analysis, and Storage services.
Experimental Validation: iPhone Case Study
To prove the platform's efficacy, the authors conducted a live test tracking "iPhone" keywords on Twitter.
- Volume: 4,200 tweets collected in just 20 minutes.
- Insight: The analysis revealed a predominantly neutral-to-positive sentiment, with high activity in English and Japanese.
- Discovery: The wordcloud identified strong associations with iTunes and FaceTime, but also competitive pressure from Android mentions.
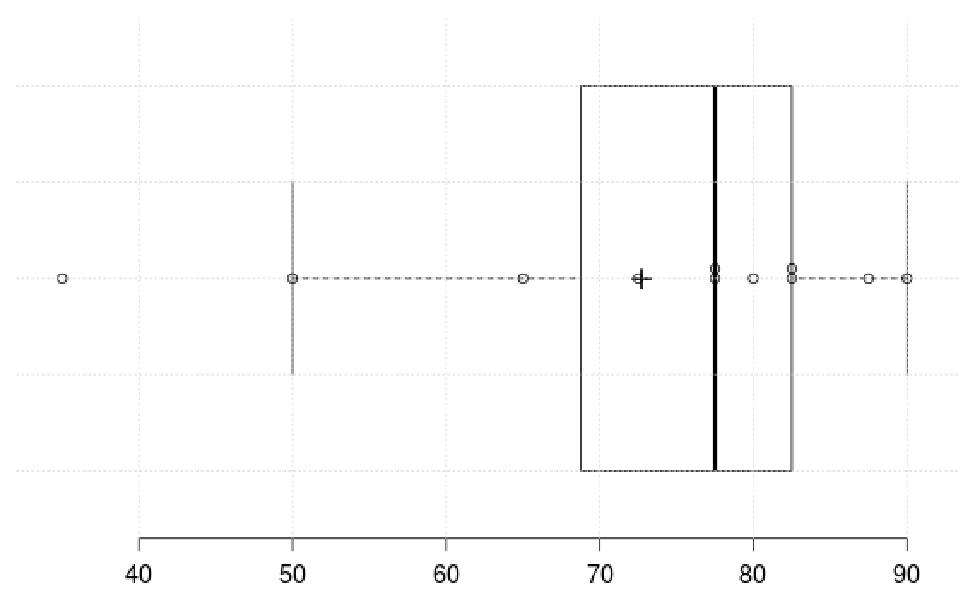 Figure 2: Sentiment analysis distribution showing the breakdown of public opinion during the experimental run.
Critical Insight & Conclusion
While SoMDA is currently in its prototyping phase, its impact is clear. By achieving a SUS score of 72.7, the authors have proven that "Good Usability" is attainable even for complex big-data tasks.
The Takeaway: The future of social science research is not in teaching every researcher how to code, but in building robust "Data Democracies"—platforms like SoMDA that hide the complexity of distributed systems behind an intuitive, visual interface.
Future Work: The authors plan to expand support to Facebook and incorporate advanced geospatial heat mapping, further closing the gap between raw Big Data and actionable human insight.