
Mapping the Maze: Using Social Networks to Unpack Cancer Care Complexity
Designing a Social Network Survey for Cancer Care Coordination
This paper proposes a Social Network Analysis (SNA) approach to investigate "Aggregate Complexity" in cancer care coordination. It details the iterative design of an egocentric network survey instrument aimed at capturing the relational interdependencies between cancer patients and their diverse care providers at the Sydney Cancer Centre.
TL;DR
Navigating cancer treatment isn't just a medical hurdle; it’s a logistical social maze. This paper explores how Social Network Analysis (SNA) can map the "Aggregate Complexity" of cancer care. However, the real breakthrough isn't just the math—it's the discovery that at the intersection of extreme illness and complex data, a qualitative interview beats a rigid survey every time.
The Problem: The Hidden Complexity of Coordination
Modern healthcare systems are "Complex Adaptive Systems." In cancer care, a patient doesn't just see one doctor; they interact with oncologists, radiologists, GPs, nurses, and family—each influencing the others.
Current research often oversimplifies this, missing the Aggregate Complexity—the dynamic interrelatedness of these actors. Researchers found that trying to measure this complexity using standard quantitative surveys often failed because:
- Cognitive Load: Patients undergoing treatment are often exhausted or stressed.
- Recall Bias: Expecting patients to remember every interaction over 6 months is unrealistic.
- Rigidity: Standard forms don't let patients tell their "story," leading to incomplete data.
Methodology: From Matrices to Narratives
The researchers initially designed a quantitative tool using Degree Centrality and Network Density formulas to quantify a patient’s support system.
The Formal Approach
To measure an actor's importance, they used Degree Centrality ():
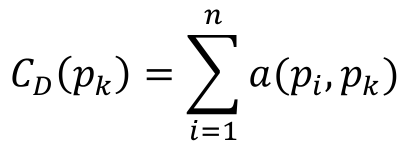 Where nodes represent care providers and edges represent communication or trust.
The Pivot: Design Evolution
The study underwent two distinct phases:
-
Phase 1 (The Survey): A complex grid requiring patients to list up to 15 people and rate their relationships in a massive adjacency matrix (see below).
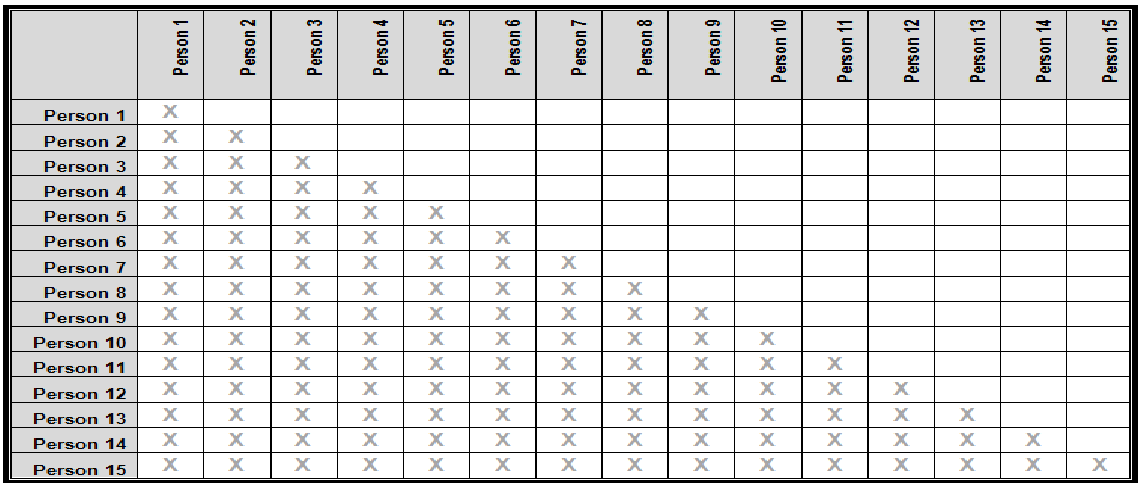 Result: Patients found this "too complicated" and stressful.
 -
Phase 2 (The Semi-Structured Interview): The team pivoted. They reduced the timeframe from 6 months to 3 and capped the "Name Generator" at 5 key individuals. Instead of a form, the researcher conducted a conversation, filling in the technical matrix on behalf of the patient.
Experiments & Results: Humanizing the Data
The pre-pilot study conducted at the Sydney Cancer Centre revealed that patients were much more capable of explaining the roles of their clinicians than filling out a chart.
| Component | Description in this Context |
|---|---|
| Ego | The Cancer Patient |
| Alters | Medical staff, family, friends providing advice |
| Multiplex Ties | Relationships with dual roles (e.g., a GP who is also a friend) |
The researchers found that by allowing "storytelling," they could capture high-quality relational data without compromising the patient's mental state. This approach successfully identified "Dense" networks (where all providers talk to each other) versus "Sparse" networks (where the patient is the only bridge between disconnected doctors), which is critical for identifying coordination breakdowns.
Critical Insight: Complexity Requires Empathy
The takeaway for the academic community is clear: Network Science is only as good as its data collection protocol. When dealing with "Aggregate Complexity" in human systems, we cannot ignore the human condition of the nodes themselves.
Limitations:
- The current study is "static"—it captures a snapshot of the network at one point in time.
- It relies on purposive sampling, which may not represent every cancer demographic.
Future Outlook: The next step is moving toward SNA-based interventions. Once we map a patient's network and find it is too fragmented (low density), healthcare systems can proactively introduce "care coordinators" to bridge the gaps evidenced by the data.