
Emotional Communities: Redefining Social Influence via the Ekman Scale
Towards detecting emotional communities in Twitter
This paper introduces a novel methodology for detecting emotional communities on Twitter by integrating user influence metrics with sentiment analysis based on the Ekman emotional scale. The approach leverages a modularity-based community detection algorithm (Blondel et al.) to group users not just by connectivity, but by shared emotional behavior and social impact.
TL;DR
This research shifts the paradigm of community detection from "who follows whom" to "who feels like whom." By combining Ekman’s emotional scale with a sophisticated Influence Metric, the authors propose a methodology that identifies smaller, more potent, and emotionally homogeneous communities on Twitter. Their findings suggest that tracking collective emotional states allows for better identification of influential clusters than structural graph data alone.
Problem & Motivation: Beyond the Topology
Most community detection algorithms treat social networks as cold, mathematical graphs—nodes and edges defined by clicks and follows. However, human interaction is fueled by affect. Traditional modularity-based approaches often miss the "why" behind interaction: the shared anger of a political movement or the collective joy of a fanbase.
The authors argue that ignoring User Emotional Behavior leads to communities that are structurally large but functionally diluted. To solve this, they integrate psychological profiling into the community extraction pipeline, aiming for "Influential Emotional Communities."
Methodology: The Fusion of Affect and Influence
The methodology is divided into three critical layers:
1. The Emotional Profile
Using Natural Language Processing (NLP), specifically POS tagging and parsing, the system analyzes tweets at the sentence level. Each tweet is mapped onto the Ekman Emotional Scale (Joy, Sadness, Anger, Fear, Surprise, Disgust). This creates a temporal "emotional signature" for every user.
2. The Influence Metric
Influence is not just about follower counts. The authors define a comprehensive metric calculated as: This formula captures both the authority (Follower-to-Following ratio) and the activity level (frequency and engagement) of a user.
3. Community Decomposition
The system uses the Louvain Method (Blondel et al.) for modularity optimization but modifies the objective function to prioritize nodes with similar emotional and influence profiles.
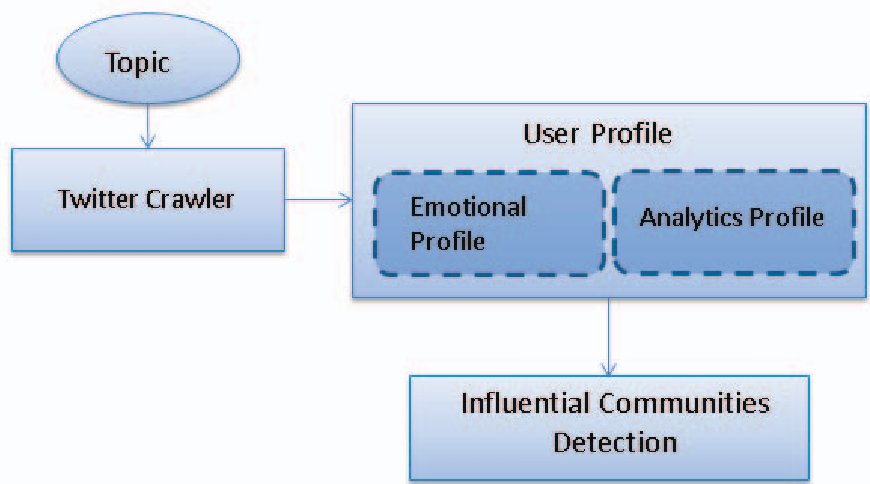 Fig 1: The proposed architecture integrating sentiment analysis with influential metrics.
Experiments & Results: The #Grexit Case Study
The methodology was tested on a dataset centered around the #Grexit hashtag, covering a 14-day window. With 700 active nodes, the results were striking:
- Higher Density with Fewer Nodes: The top-ranked communities identified by the emotional methodology were smaller than those found by purely structural methods.
- Homogeneity: By filtering through the emotional lens, the extracted groups showed a much higher consistency in sentiment, making them more "influential" as a collective unit.
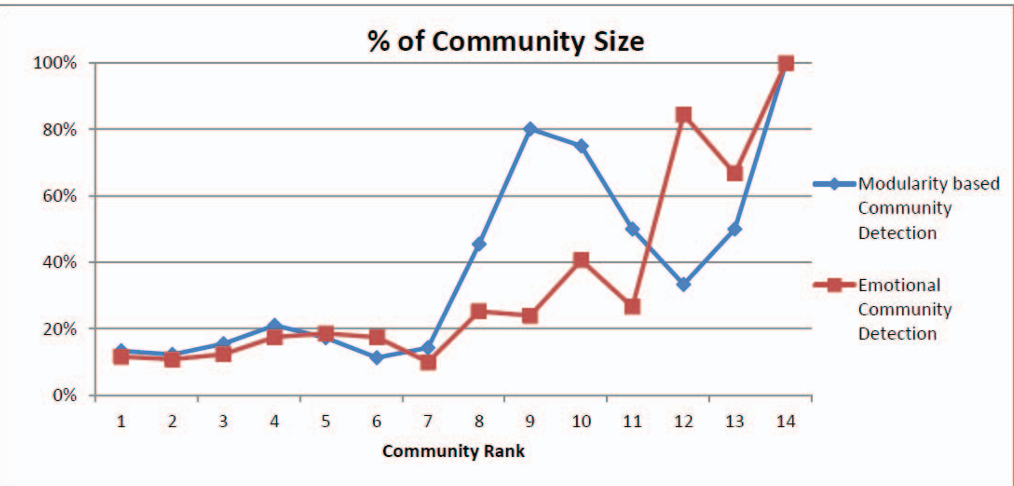 Fig 2: Comparison of community size—emotional communities require fewer nodes to achieve higher influence ranks.
Critical Insight & Conclusion
This work highlights a fundamental truth about modern social media: Emotion is the glue of social structure.
By proving that emotional communities are more compact and potentially more influential, the authors provide a roadmap for more effective market segmentation and political analysis. However, a notable limitation is the reliance on a 24-hour frequency window, which might be too short to capture long-term emotional evolution. Future research should look into "emotional shifts" over time to see how communities fragment or merge when the collective mood changes.
Takeaway: If you want to find the true core of a movement, don't just look at the bridge nodes—look for the emotional heartbeat.