
dCW: Unveiling the Neural "Black Box" in Agricultural Trade Analytics
Detecting Feature Interactions in Agricultural Trade Data Using a Deep Neural Network
The paper introduces deep Connection Weight (dCW), a novel extension of the connection weight method designed to interpret complex feature interactions in Deep Neural Networks (DNNs). Applied to agricultural trade data within a Deep Belief Network (DBN) framework, it successfully ranks input feature contributions in an unsupervised learning context.
TL;DR
Neural networks are notoriously difficult to interpret, often dismissed as "black boxes." This paper introduces the deep Connection Weight (dCW) method, a mathematical extension that allows researchers to "peek" inside deep architectures (like Deep Belief Networks) to see exactly how input signals like commodity prices and slaughter volumes interact to influence global trade predictions.
Contextual Positioning
In the landscape of AI, we often focus on accuracy at the expense of interpretability. While Deep Learning has revolutionized fields from CV to NLP, the agricultural sector (Agri-analytics) requires transparency for policy-making. This work moves beyond "SOTA-chasing" to provide a diagnostic tool, bridging the gap between shallow, interpretable models and deep, opaque ones.
The "Black Box" Problem in Agri-Analytics
Traditional machine learning often fails to capture the non-linear, latent trends in volatile agricultural markets. While Deep Neural Networks (DNNs) can model these complexities, they lose the "why" behind the "what."
Previous methods like Garson’s Algorithm or the Connection Weight (CW) method only worked for:
- Supervised learning (classification/regression).
- Shallow architectures (one hidden layer).
This paper addresses the "How" for deep, unsupervised models.
Methodology: The dCW Breakthrough
The core innovation is the generalization of the connection weight score. In a shallow network, the score is simply the product of input-to-hidden and hidden-to-output weights. The authors extend this to an -layered network using a cumulative dot product:
This formula generates a feature score matrix, where each entry reveals the influence of a specific input feature on a specific node in the final hidden representation.
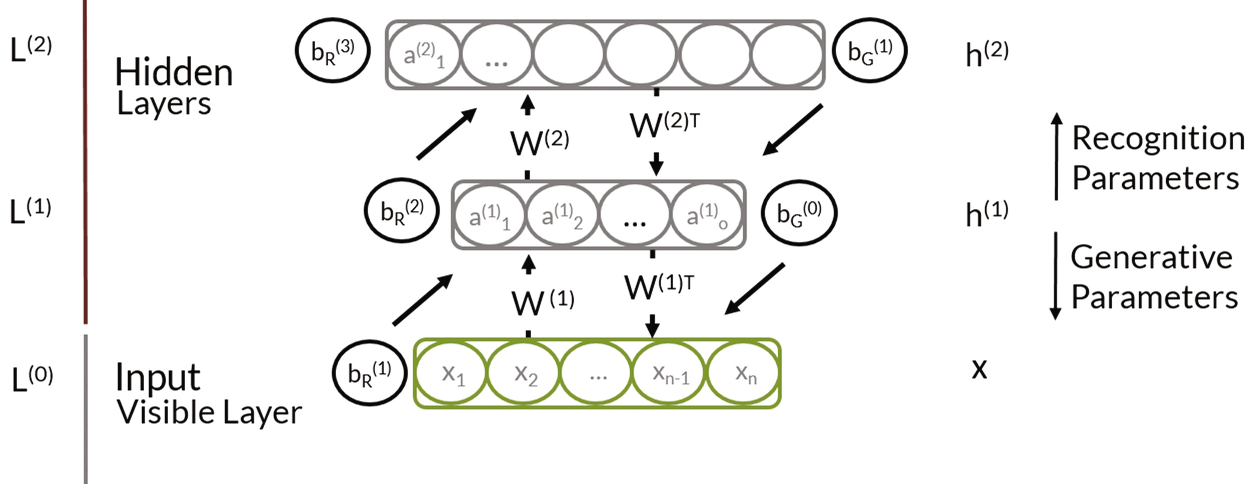 Figure 1: The architecture of a Deep Belief Network (DBN) where dCW is applied to interpret latent features.
Experiments and Results
The authors tested dCW on a massive EU trade dataset (2010–2014) involving pork cuts, feed prices, and slaughter information.
Key Findings:
- Feature Hierarchy: A small subset of features dictates model behavior. Supply-side metrics like
IrishKillandNIKill(number of animals slaughtered) were the most dominant contributors. - Model Efficiency: The best-performing DBNs used a ratio of roughly 3:1 between layers, suggesting that data compression followed by expansion is vital for capturing trade interactions.
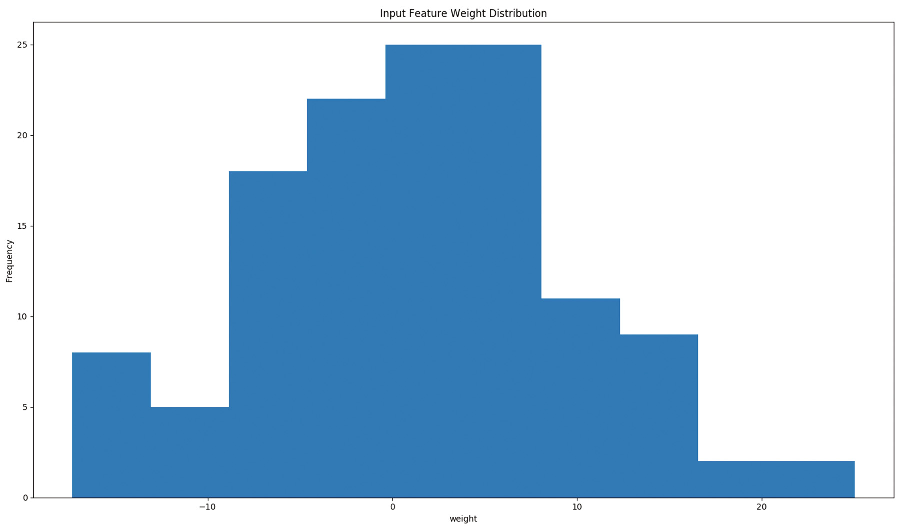 Figure 2: Distribution of cumulative weight scores, showing that input contributions are normally distributed but dominated by a core set of features.
| Rank | Feature | Cumulative Weight | Contribution % |
|---|---|---|---|
| 1 | IrishKill | 25.035 | 2.94% |
| 2 | NIKill | 21.534 | 2.53% |
| 3 | FranMill (Feed) | 17.487 | 2.05% |
Critical Insight & Conclusion
The dCW method represents a significant step toward XAI (Explainable AI) in resource-critical sectors. By quantifying the "influence" of a variable through multiple layers of non-linear operations, we can move from merely observing market trends to understanding their causal drivers (e.g., how the price of Rapeseed in Germany interacts with export volumes in Brazil).
Limitations: While dCW ranks importance, it does not yet fully map the directionality of individual variable reconstructions in a way that is easily human-readable without further post-processing.
Future Outlook: The authors suggest the next step is tracking the effect of each input on specific variable reconstructions, potentially allowing for a "per-sample" explanation of model decisions.