
Detecting the "Aha!" and "Uh-oh!" Moments: Multi-Sensor Emotion Detection in Visual Analytics
Detecting Negative Emotion for Mixed Initiative Visual Analytics
The paper presents a multi-sensor machine learning model designed to detect negative emotional states (frustration and confusion) during visual analytics tasks. By combining Galvanic Skin Response (GSR) and eye-tracking data, the authors achieved an 88% recall rate for negative emotion detection using a Random Forest classifier.
TL;DR
Researchers from Ontario Tech University have developed a robust machine learning framework to detect when a data analyst is getting frustrated or confused. By fusing eye-tracking and skin conductance data, their Random Forest model achieves an 88% recall rate, allowing future visualization tools to step in and offer help precisely when the user hits a wall.
Context: Why "Boredom" in Gaming is different from "Frustration" in Data
Most affective computing research focuses on entertainment or education. However, Visual Analytics (VA) is a unique beast. Interpreting complex scatter plots or multi-dimensional filters requires high cognitive focus. When a user fails to find a pattern, they don't just get "stressed"; they experience a specific sequence of visual searching and physiological arousal.
The authors argue that existing models for reading or gaming don't translate to the "visual foraging" behavior seen in tools like PivotSlice. They recognized that to build a truly helpful assistant, the system must first know—unobtrusively—whenever the user is struggling.
Methodology: High-Tech Empathy through Biometrics
The researchers utilized two primary sensors:
- Shimmer GSR: Measures skin conductance (sweat gland activity) to track emotional arousal.
- Tobii X60 Eye Tracker: Tracks gaze location and pupil dilation to measure cognitive load and "visual panic."
The Feature Engineering Secret Sauce
To make the model work across different individuals, the team didn't just look at raw values. They used Z-score standardization to create a personalized baseline and applied 7-point Lagrangian interpolation to detect subtle changes in heart rate and skin response relative to the task's difficulty.
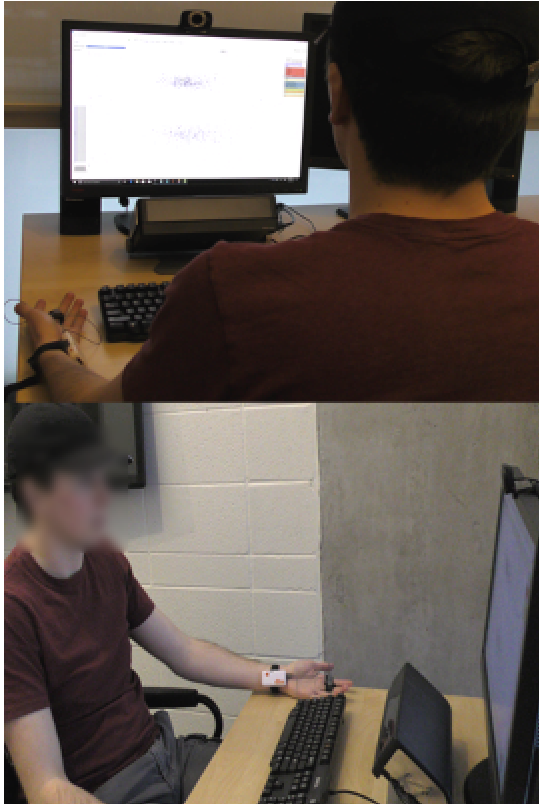 The PivotSlice interface used in the study, featuring complex multi-dimensional filtering.
Smart Labeling: Retrospective Think-Aloud
Instead of making participants watch 25 minutes of video (which is boring and leads to bad data), the authors used a "candidate peak" method. The system flagged high-intensity moments in the GSR data and only asked users to explain what they felt during those specific 7 clips. This created a high-quality labeled dataset with minimal human effort.
Experiments & Results: Random Forest Reigns Supreme
The researchers tested three main classifiers: K-Nearest Neighbor (KNN), Support Vector Machines (SVM), and Random Forest (RF). Due to the "Rare Event" nature of frustration (people aren't frustrated 100% of the time luckily!), they used SMOTE to balance the training data.
| Model | Recall (Negative Emotion) |
|---|---|
| KNN | 55% |
| SVM | 67% |
| Random Forest | 88% |
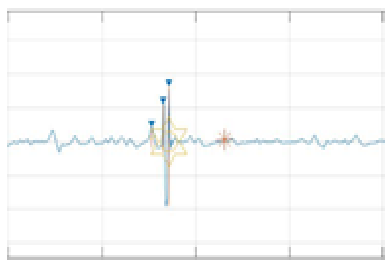 Visualizing the peak detection in GSR data using Lagrangian interpolation.
The model revealed a fascinating "Stress Signature" in visualization tasks:
- GSR (Arousal): Spikes significantly (e.g., from 0.066 to 1.787).
- Mean Fixation Duration (MFD): Drops sharply (e.g., from 98ms to 30ms).
This suggests that when we get frustrated, our eyes start darting around rapidly (lower fixation) while our stress levels climb—a state the authors call "negative mind states."
Critical Insight & Future Outlook
The real value of this paper isn't just the 88% recall; it's the Zero-Intervention potential. By using unobtrusive sensors like a wristband and a remote eye-tracker, the analysis environment remains natural.
Limitations: The study had a significant gender imbalance (26 male vs 2 female), which could affect the physiological generalizability, as stress responses can vary across demographics.
The Future: We are moving toward Mixed-Initiative Visual Analytics. Imagine a version of Tableau or PowerBI that notices your gaze is erratic and your stress is rising, and then automatically suggests: "It looks like you're struggling with this filter; would you like me to simplify the view?" That is the promise of this research.
Key Takeaway
"Frustration is a signal, not just a feeling." By quantifying the relationship between skin response and gaze saccades, we can transform software from a passive tool into an active, empathetic partner in data discovery.