
The Affect-Aware City: Decoding Urban Emotions via Twitter Streams
Detection and Visualization of Emotions in an Affect-Aware City
The paper introduces a framework for an "Affect-Aware City" that detects and visualizes the emotional states of citizens using geo-tagged Twitter data. Leveraging a 4D dimensional emotion model (PADU) and a neural network, the system translates textual features into affective vectors for real-time urban mapping.
TL;DR
In the evolution of Smart Cities, we often measure everything except how people feel. This paper proposes a system that treats citizens as "soft sensors." By training a neural network on geo-tagged tweets and mapping them using a sophisticated 4D emotional model (PADU), the researchers have created a live "emotional weather map" of the city, offering urban planners a new form of implicit feedback.
Moving Beyond Quantitative "Smartness"
Most smart city initiatives are obsessed with "hard" data: water flow, electricity consumption, and traffic congestion. While useful, these metrics miss the human element. The authors argue for the Affect-Aware City, where the collective mood of the population informs decision-making.
The challenge? Detecting emotion from text is notoriously hard. People use sarcasm, slang, and emoticons that traditional algorithms struggle to parse. Furthermore, most researchers use "Discrete Models" (labeling a tweet as simply "Happy" or "Sad"). This paper rejects that binary, opting instead for a Dimensional Model that captures the nuance of human feeling.
Methodology: The 4D Emotion Engine
The core of the system is the PADU model:
- Pleasantness (P): Positive vs. negative valence.
- Arousal (A): Intensity of physiological change (e.g., calm vs. frantic).
- Dominance (D): The feeling of being in control vs. being overwhelmed.
- Unpredictability (U): The novelty or unexpectedness of the stimulus.
Data Harvesting & The Neural Network
To avoid the labor-intensive task of manual labeling, the authors used hashtags as self-labeled ground truth. If a user writes "Stuck in traffic #angry," the system assumes the emotional content matches the vector for "anger."
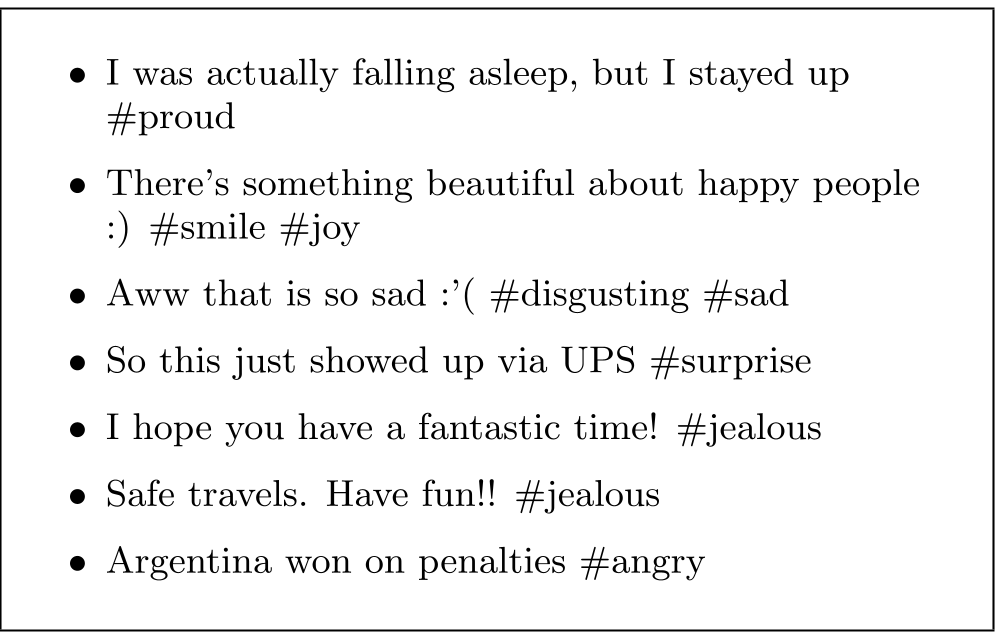 Figure 1: The dual-phase workflow involving offline training via hashtags and online real-time prediction.
The features extracted include:
- Normalized Text: Expanding "gonna" to "going to" and reducing "boooored" to "bored."
- Emoticon Categorization: Grouping 130 variations of emojis into 30 semantic categories.
- Neural Regression: Unlike simple classification, the network predicts four continuous values, allowing for "blended" emotions.
Visualizing the Urban Heartbeat
The most striking contribution is the visualization. Since PADU is 4D, representing it on a 2D map is difficult. The authors used concentric disks (reminiscent of the Towers of Hanoi).
- Color coding: Pleasantness (Grey), Arousal (Green), Dominance (Red), and Unpredictability (Blue).
- Size: The radius of the stack indicates the volume of tweets in that specific area.
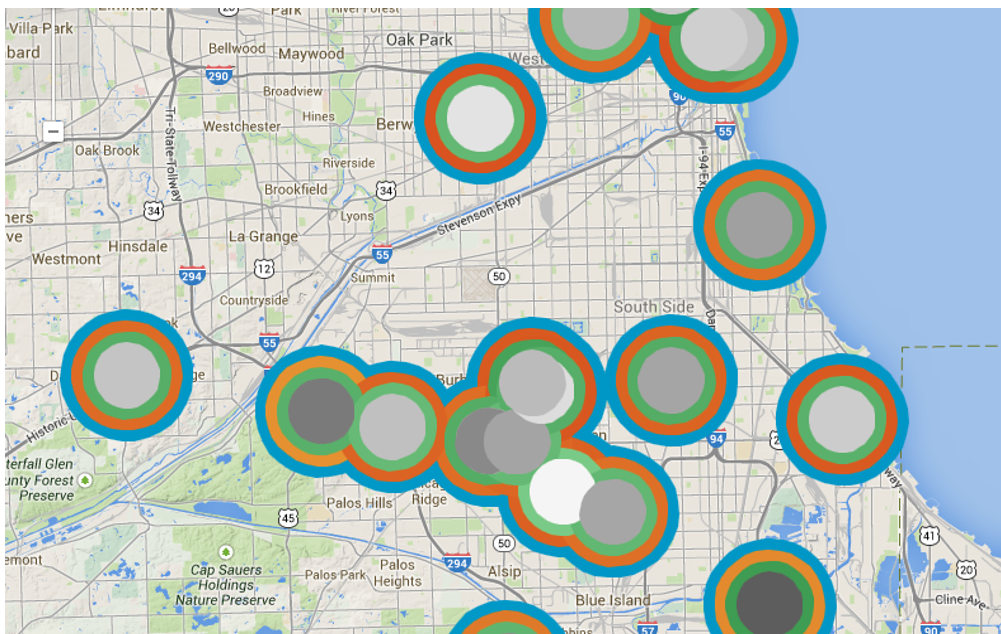 Figure 2: Example of emotional aggregation in Chicago, showing how different dimensions occupy layers of the visualization.
Results and Critical Insights
The model achieved a correlation of 0.51. While this might seem low in a computer vision context, in the realm of human affect, it actually matches the level of agreement between two human experts (inter-annotator agreement).
Key findings from the experiments:
- Pleasantness is the easiest dimension to detect (70% human agreement).
- Arousal is the hardest (only 17% agreement), as text often lacks the physiological cues present in voice or gesture.
- The system scales effectively from individual city blocks to a global view of 3 million tweets.
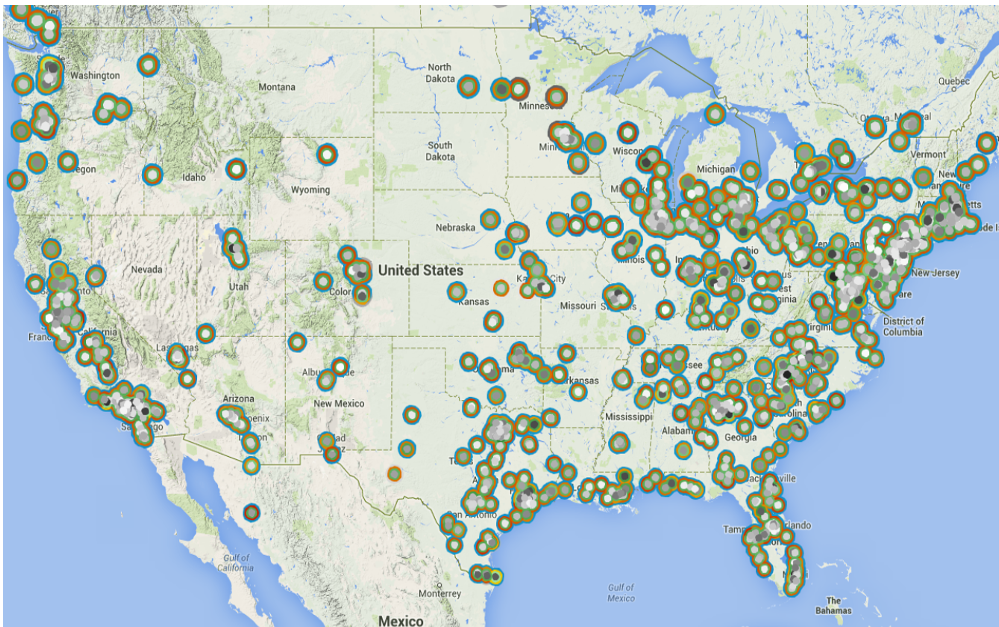 Figure 3: Continental-scale visualization of aggregated emotions across the USA.
Conclusion: The Future of Urban Sentiment
This work moves us closer to a city that "feels" its citizens' frustrations and joys in real-time. However, the reliance on geo-tagged tweets is a significant limitation, as few users enable this feature.
Future iterations will likely need to incorporate Large Language Models (LLMs) to better handle the sarcasm and nuance that a simple Feed-Forward Neural Network might miss. Nonetheless, the framework provides a foundational "blueprint" for adding a human layer to the cold, hard data of the smart city.