
Improved K-Means: Redefining Customer Value through the LRFMM2 Model
Determination of Customer Satisfaction using Improved K-means algorithm
The paper introduces an improved K-means clustering algorithm specifically designed for Customer Relationship Management (CRM). By integrating a novel "Maliciousness" (M2) feature into the traditional LRFM model (Length, Recency, Frequency, Monetary) and automating the selection of initial cluster centers and the optimal cluster count, the method achieves superior performance in both speed and accuracy.
TL;DR
This research addresses the instability and lack of qualitative depth in traditional customer clustering. By introducing an LRFMM2 model (adding a Maliciousness/Satisfaction feature) and a self-optimizing K-means variant, the authors achieve a dramatic reduction in clustering error (SSE reduction from 5.4 to 0.07) while automating the determination of the optimal number of customer segments.
Context: Why Traditional CRM Clustering Fails
In the world of Customer Relationship Management (CRM), K-means is the "workhorse" for identifying behavioral patterns. However, it suffers from three chronic ailments:
- Sensitivity to Noise: A few unhappy or "outlier" customers can shift cluster centers, leading to poor strategy alignment.
- The "K" Problem: Choosing the number of clusters (K) is often a manual, "trial-and-error" process.
- Attribute Blindness: Traditional RFM (Recency, Frequency, Monetary) models ignore the length of the relationship and, crucially, the satisfaction level of the customer.
Methodology: The LRFMM2 Framework
The core innovation lies in the transition from LRFM (Length, Recency, Frequency, Monetary) to LRFMM2.
1. Handling the "Malicious" Feature (M2)
The authors define as a measure of customer dissatisfaction. Instead of treating dissatisfied customers as mere data points, the algorithm identifies them as "malicious outliers" if they exceed a specific threshold. These are filtered out before the heavy lifting begins to ensure stable cluster formation.
2. Automating the "Great Jump Point"
Rather than asking the user for , the algorithm sorts data by their Customer Life cycle Value (CLV) and identifies "mutations" or large gaps in the distance between consecutive data points. If a gap exceeds a dynamic threshold , the algorithm increments the cluster count.
3. Smart Seeding
Instead of random initialization, the authors use a deterministic approach:
- The first center is the data point closest to the overall average.
- Subsequent centers are chosen by finding points with the maximum average distance from existing centers.
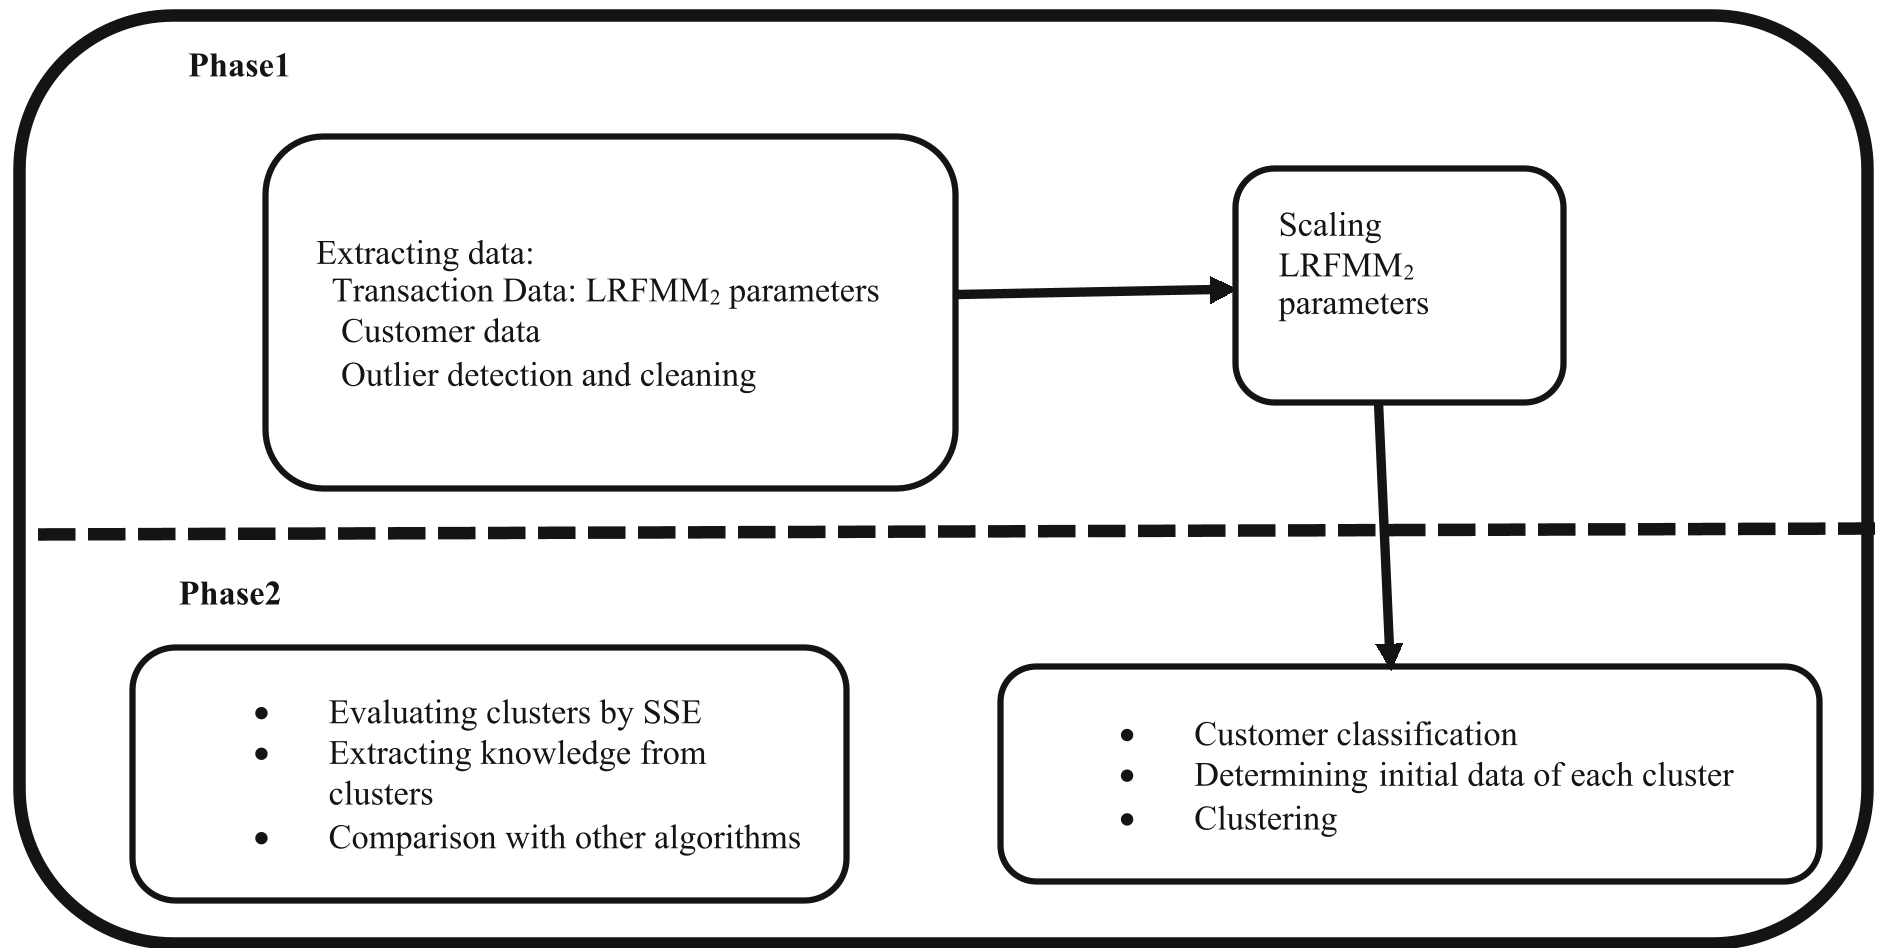 Figure 1: The two-phase implementation: Data Pre-processing and Modeling.
Experimental Results: Precision Matters
The proposed model was tested against DBSCAN, Hierarchical Clustering, and IK-means+. While DBSCAN excels in raw speed, it often fails to find the most representative centers in high-dimensional CRM data.
| Method | Number of Clusters (K) | SSE (Sum of Squared Errors) |
|---|---|---|
| Proposed Algorithm | 15 | 0.072 |
| Standard K-means | 15 | 0.415 |
| IK-means+ | 15 | 5.410 |
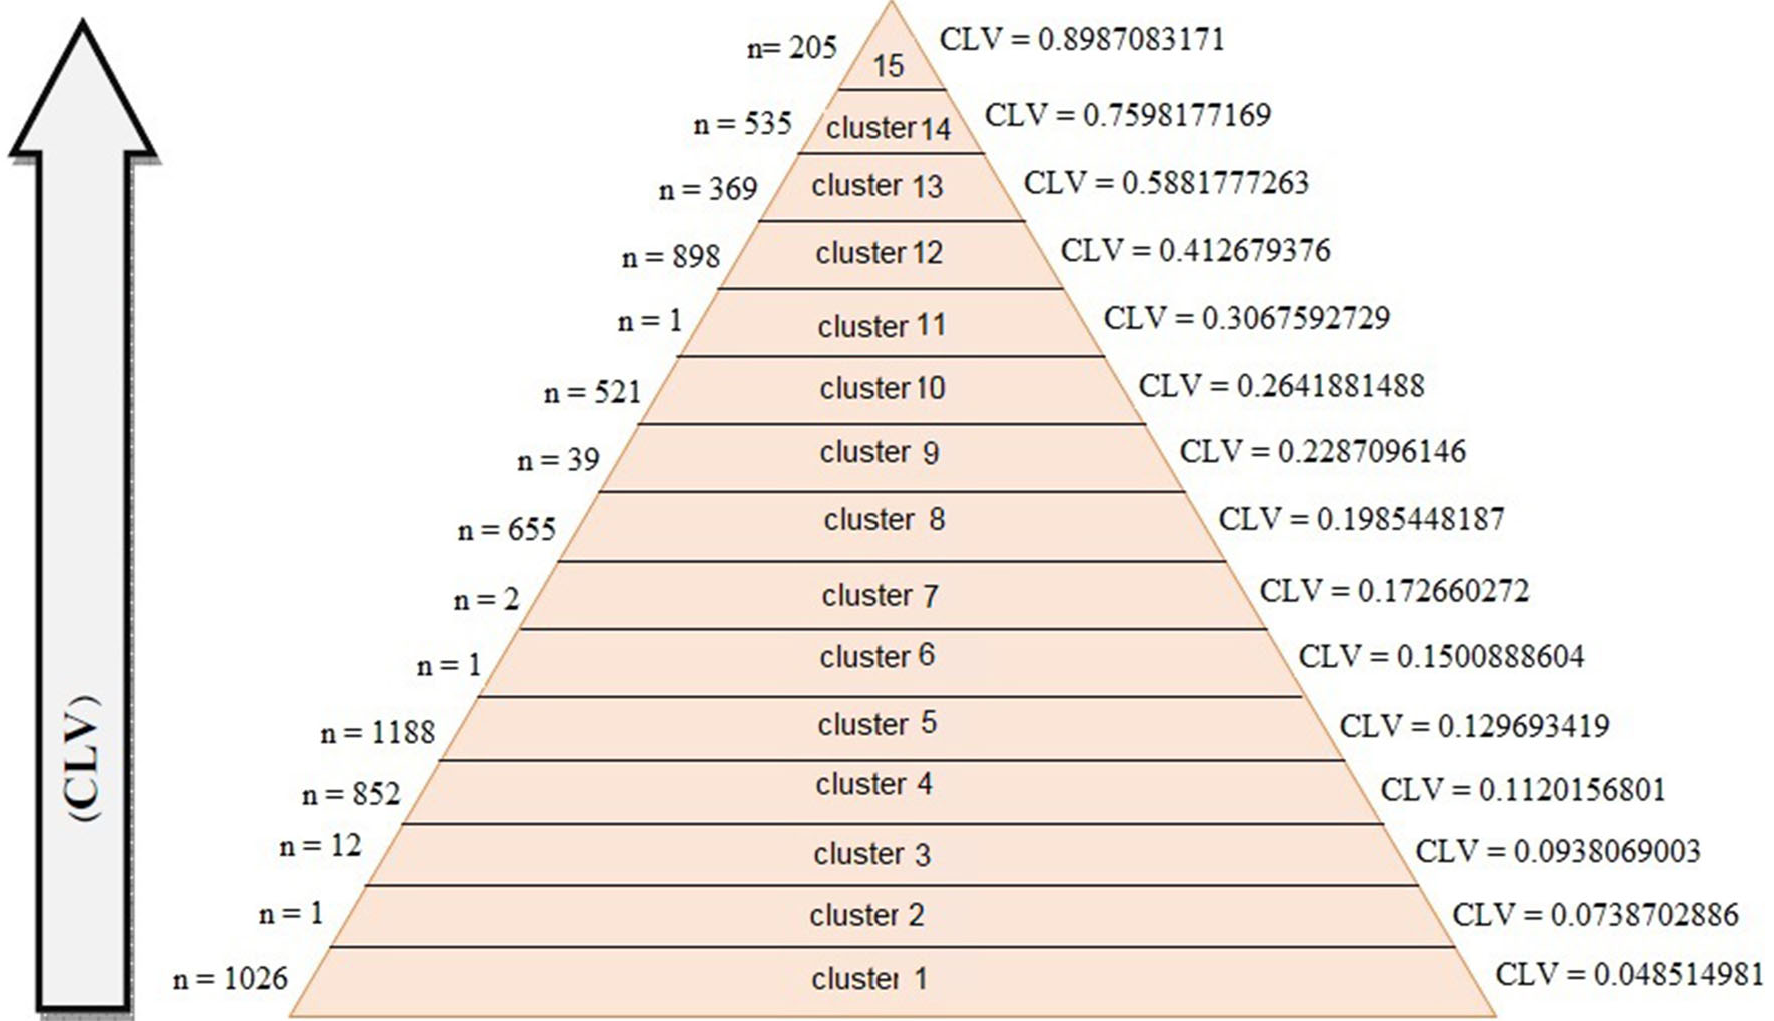 Figure 2: The final output: A Customer Value Pyramid used to drive targeted marketing strategies.
Critical Analysis & Insights
The strength of this work is the physical intuition that customer satisfaction is not just an "extra label" but a fundamental coordinate in the behavioral space.
Key Takeaways for Data Scientists:
- Preprocessing is Modeling: The way the authors handle outliers (using the specific condition) is as important as the clustering itself.
- Dynamic Scaling: The use of parameter allows the threshold for new clusters to scale with the dataset size (), preventing over-segmentation in large databases.
Limitations: The current approach relies on "expert opinion" to set weights for L, R, F, M, and M2 features via AHP (Analytic Hierarchy Process). Future work could likely benefit from learning these weights automatically through a semi-supervised approach.
Conclusion
By fixing the "initialization" and "K-selection" weaknesses of K-means and enriching the feature set with satisfaction metrics, this study provides a robust blueprint for modern CRM systems. It demonstrates that the path to a better algorithm often involves looking closer at the domain-specific nature of the data itself.